

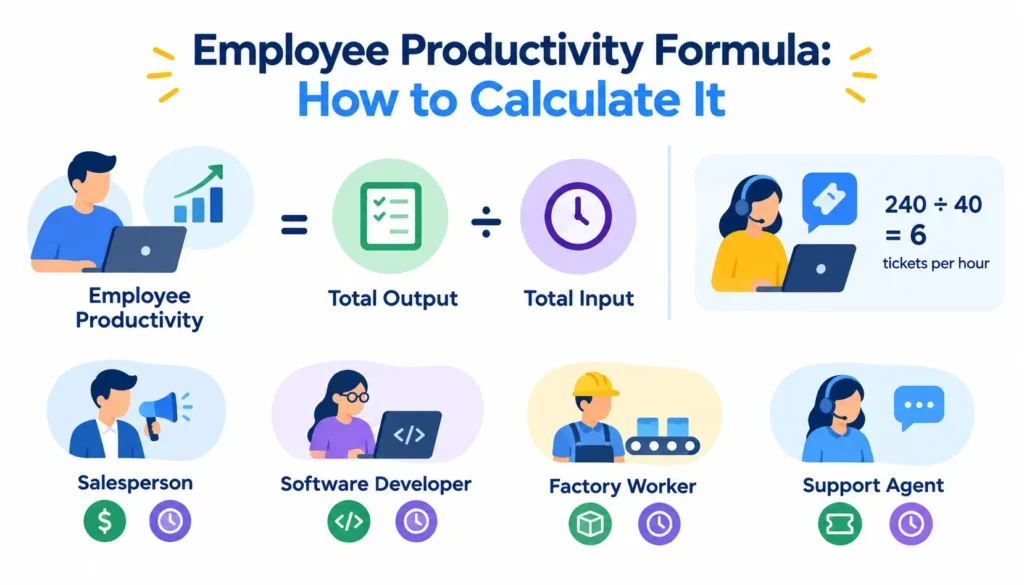
If you want the short answer: Employee Productivity = Total Output ÷ Total Input. Say a support agent resolves 240 tickets in a 40-hour week, that’s 240 ÷ 40, or 6 tickets per hour. That’s the core employee productivity formula in its simplest form.
But here’s the catch: the right way to calculate employee productivity for a salesperson looks nothing like the formula you’d use for a software developer or a factory worker. Output and input change depending on the job. This guide walks through the formula, real examples by role, common mistakes, and how to actually use the numbers once you have them.
What Is the Employee Productivity Formula?
Basic employee productivity formula
At its core, productivity is a ratio. You’re comparing what someone (or a team) produced against what it took to produce it. Wikipedia’s general entry on productivity defines it the same way at the economic level: a measure of output relative to the inputs used to create it.
Employee Productivity = Total Output ÷ Total Input
That’s it. The complexity comes from deciding what counts as “output” and what counts as “input” for a specific role. That’s where most people trip up.
What does output mean?
Output is whatever value the employee or team actually creates. Depending on the job, that could be:
- Units produced
- Revenue generated
- Tickets resolved
- Sales closed
- Projects completed
- Deliverables shipped
What does input mean?
Input is the resource spent to get that output. Common inputs include:
- Hours worked
- Number of employees
- Labor cost
- Materials
- Capital
- Other resources (equipment, software, time from support functions)
Simple employee productivity example
Let’s go back to the ticket example, since it’s the cleanest way to see the formula in action.
A customer support rep resolves 240 tickets over a 40-hour work week.
Employee Productivity = 240 tickets ÷ 40 hours = 6 tickets per hour
That single number tells you the rate of output relative to time worked. It doesn’t tell you whether those tickets were resolved well, we’ll get to that later, but it’s the starting point.
How to Calculate Employee Productivity Step by Step
Step 1: Define the output
Decide what “getting work done” actually looks like for this role. Is it units made, calls closed, code shipped, or revenue booked? Be specific. “Getting more done” isn’t measurable, but “units produced” is.
Step 2: Choose the input
Pick the resource you’re comparing that output against. Hours worked is the most common choice, but headcount, labor cost, or materials used can matter more depending on what you’re trying to learn.
Step 3: Use the same measurement period
Output and input have to come from the same window of time: the same week, month, or quarter. Comparing last month’s output to this week’s hours will give you a meaningless number.
Step 4: Apply the formula
Divide output by input. That’s the calculation itself. The hard part is everything before this step.
Step 5: Compare the result with a relevant benchmark
A number on its own doesn’t mean much. Compare it to a past period, a team average, or an industry benchmark to see whether it’s actually good, bad, or normal.
Step 6: Check quality and business impact
Before you act on the number, ask whether the output was actually valuable. High output with sloppy quality isn’t real productivity, more on that below.
Employee Productivity Formula Examples
Different roles need different formulas. Here’s how the basic ratio adapts across common job types.
Example 1: Manufacturing employee
Units produced ÷ Labor hours
A factory worker who assembles 320 units in an 8-hour shift has a productivity rate of 40 units per hour.
Example 2: Customer service employee
Tickets resolved ÷ Hours worked
This is the formula we used in the opening example, straightforward, and easy to track with most helpdesk software.
Example 3: Sales employee
Revenue or deals closed ÷ Salesperson
If a rep closes $80,000 in deals in a month, that’s their productivity figure for the period. You can also measure this per hour worked, or per lead handled, depending on what you’re trying to optimize.
Example 4: Marketing employee
Qualified leads or completed campaigns ÷ Time or input
Marketing output is fuzzier than sales or manufacturing, so it’s common to track qualified leads generated or campaigns shipped against hours or budget spent.
Example 5: Software development team
Single-number formulas don’t work well for engineering. Most teams instead combine:
- Completed deliverables (features, tickets, story points)
- Cycle time (how long work takes from start to finish)
- Quality (bugs found post-release)
- Defect rate
A developer who ships fast but creates a pile of bugs isn’t actually more productive. They’ve just moved the work downstream.
Example 6: Professional services
Revenue or billable output ÷ Labor hours
Consultants, lawyers, and agencies often track billable hours against revenue generated, since time is literally the product being sold.
7 Employee Productivity Formulas You Can Use
1. Basic productivity formula
Output ÷ Input. The general-purpose version that everything else is built from.
2. Labor productivity formula
Output ÷ Labor hours
Hours worked is often a more informative input than headcount, because two employees working very different schedules (one full-time, one part-time) shouldn’t be compared as if they contributed equally. The OECD, for example, emphasizes hours worked rather than headcount as the standard labor-input measure in many of its productivity statistics. It’s a more accurate reflection of actual effort spent.
3. Productivity per employee
Total output ÷ Number of employees
Useful for quick team-level comparisons, though it flattens out differences in hours worked.
4. Revenue per employee
Revenue ÷ Number of employees
A common financial productivity metric, especially for benchmarking a company against industry peers.
5. Productivity percentage
Actual output ÷ Target output × 100
This tells you how close someone is to a goal, expressed as a percentage. Handy for performance reviews.
6. Productivity index
Current productivity ÷ Base productivity × 100
This tracks change over time relative to a fixed starting point, which is useful for spotting trends.
7. Multifactor productivity
Output ÷ Combined inputs (labor, capital, materials, etc.)
This is the most complete version of the formula, since it accounts for more than just labor. It’s more complex to calculate but gives a fuller picture of efficiency, similar to how economists measure productivity at a national level.
Employee Productivity Formula Cheat Sheet
| Metric | Formula | Best used for |
| Output per hour | Output ÷ Hours | Hourly productivity |
| Output per employee | Output ÷ Employees | Workforce comparisons |
| Revenue per employee | Revenue ÷ Employees | Financial output |
| Goal attainment | Actual ÷ Target × 100 | Target performance |
| Productivity index | Current ÷ Base × 100 | Change over time |
| Multifactor productivity | Output ÷ Combined inputs | Resource efficiency |
How to Choose the Right Employee Productivity Formula
Use output per hour when…
You need a quick, comparable rate, especially for roles with clearly countable output, like support tickets or units assembled.
Use output per employee when…
You’re comparing teams or departments of different sizes and want a per-head view of contribution.
Use revenue per employee when…
You care about financial efficiency: how much revenue the business generates relative to headcount. This is common in exec-level reporting.
Use goal attainment when…
You’ve already set clear targets and want to know how close someone got, rather than a raw output number.
Use multifactor productivity when…
Labor isn’t the only input that matters. Think manufacturing, where materials and equipment usage matter as much as hours worked.
Use multiple metrics when measuring knowledge work
For roles like software development, design, or strategy, no single ratio captures the full picture. Combine output, speed, and quality metrics instead of forcing one formula to do all the work.
Employee Productivity by Role
Manufacturing
Units produced per hour, defect rate, and machine uptime are the usual trio here, since output is physical and countable.
Sales
Revenue closed, deals per rep, and conversion rate from lead to close matter more than raw activity like calls made.
Customer service
Tickets resolved per hour, first-contact resolution rate, and customer satisfaction scores together give a fuller picture than ticket count alone.
Marketing
Qualified leads generated, campaign completion, and cost per lead are common, since marketing output is often indirect.
Software development
Cycle time, completed story points, and defect rate. Speed alone is misleading without a quality check.
Professional services
Billable hours, utilization rate, and revenue per consultant, since time is the direct input being sold.
Administrative roles
Tasks completed, turnaround time, and accuracy. Administrative work is often under-measured because output isn’t as visible as sales or manufacturing.
Managers and leadership
Team output, retention, and goal attainment across direct reports. A manager’s productivity is really a reflection of their team’s results.
It’s worth saying plainly: there’s no single metric that works across every one of these roles. Trying to force one productivity formula onto the whole company usually produces misleading numbers.
Employee Productivity vs Efficiency vs Utilization
These three words get used interchangeably, but they measure different things.
Productivity
How much output you get relative to input. It’s the volume-and-value question.
Efficiency
How well resources are used to produce that output. Doing the same job with less waste, not necessarily doing more of it.
Utilization
How much of someone’s available time is spent on billable or productive work, versus idle or administrative time.
Performance
A broader term that usually includes productivity plus quality, behavior, and goal achievement. It’s the umbrella category the other three sit under.
Why these metrics should not be treated as the same thing
An employee can be highly efficient (little wasted effort) but not very productive (low total output), or highly utilized (fully booked) but inefficient (busy without being effective). HR and people-ops professionals on Reddit’s r/humanresources frequently flag this exact confusion: teams that chase utilization rates end up burning people out without actually improving output. Treating these as synonyms is one of the fastest ways to make bad management decisions.
Why Output Alone Does Not Measure True Productivity
Quantity vs quality
An employee who processes twice the volume but makes twice the errors hasn’t actually doubled their value. Someone else now has to fix the mistakes.
Speed vs accuracy
Fast work that needs to be redone isn’t fast at all once you count the rework.
Activity vs meaningful output
Being busy and being productive aren’t the same thing. Answering 50 emails a day means nothing if none of them move the actual work forward.
Hours worked vs actual value created
Someone working 50 hours isn’t automatically more productive than someone working 35. What matters is what got done in that time, not the time itself.
Context and job complexity
A junior employee handling routine tasks will naturally show higher “output per hour” than a senior employee solving harder, less repeatable problems. Comparing them on raw output is unfair and inaccurate.
Why more monitoring does not automatically mean more productivity
Tracking keystrokes or screen time can create a false sense of visibility. Monitoring activity is not the same as monitoring productivity, a distinction well documented in Wikipedia’s entry on employee monitoring, which notes that increased surveillance doesn’t reliably correlate with improved output.
How to Measure Employee Productivity Accurately
Set a baseline
You need a starting point before you can say productivity went up or down. Measure current performance before making changes.
Choose role-specific KPIs
Pull metrics from the “by role” list above rather than applying one generic formula company-wide.
Standardize the measurement period
Always compare the same time windows, weekly to weekly, monthly to monthly, so the numbers are apples to apples.
Track quality alongside quantity
Pair every output metric with a quality check: error rate, rework rate, or customer satisfaction.
Compare like with like
Compare similar roles, similar seniority, and similar workloads. Comparing a senior rep to a new hire isn’t a fair productivity comparison.
Review trends rather than isolated numbers
One bad week doesn’t mean someone’s underperforming. Look at the pattern over several measurement periods before drawing conclusions.
Combine quantitative and qualitative measures
Numbers tell you what happened. Manager feedback and peer input tell you why. Use both.
Employee Productivity Metrics to Track
- Output per hour: the core rate of work
- Task completion rate: percentage of assigned work finished on time
- Revenue per employee: financial output per head
- Utilization rate: percentage of available time spent on productive work
- Quality/error rate: how much output needs correction
- Cycle time: how long work takes from start to finish
- Customer satisfaction: a proxy for output quality in service roles
- Rework rate: how often output has to be redone
- Goal attainment: actual results versus set targets
- Employee engagement: a leading indicator, since disengaged teams tend to show declining productivity over time
No single metric on this list tells the full story alone. Combining a few of them, output, quality, and engagement, for instance, gives a much more honest read on real performance.
How to Calculate Employee Productivity in Excel or Google Sheets
Basic spreadsheet setup
Set up three columns: Employee, Output, Hours, then divide.
| Employee | Output | Hours | Productivity |
| Employee A | 240 | 40 | =B2/C2 |
That formula returns 6, matching the ticket example from earlier.
Calculate revenue per employee
Divide total team revenue by headcount: =SUM(RevenueRange)/COUNT(EmployeeRange).
Calculate productivity percentage
Compare actual output to target: =ActualOutput/TargetOutput*100.
Calculate productivity index
Compare current output to a base period: =CurrentOutput/BaseOutput*100.
Build a simple productivity dashboard
Once you have these formulas in separate columns, a simple bar chart or line graph across weeks or months turns the raw numbers into a trend you can actually act on.
How to Benchmark Employee Productivity

Historical benchmarks
Compare current output to the same employee or team’s past performance. This is usually the fairest comparison you can make.
Team benchmarks
Compare individuals against the team average to spot standout performers or people who might need support.
Role-specific benchmarks
Compare like-for-like roles only: sales reps to sales reps, not sales reps to marketers.
Industry benchmarks
External data (from industry associations, trade groups, or published surveys) can tell you how your team stacks up against similar companies.
Quality thresholds
A benchmark isn’t complete without a quality floor. Output that falls below an acceptable quality bar shouldn’t count as “good” productivity, no matter how high the volume.
Why there is no universal “good” productivity score
Productivity numbers only mean something in context. A “good” score depends on the role, the industry, the tools available, and the complexity of the work. There’s no single number that applies everywhere, and treating benchmarks as universal is a common and costly mistake.
Common Employee Productivity Measurement Mistakes
- Measuring hours instead of output: time spent isn’t the same as value created
- Measuring activity instead of results: busyness isn’t productivity
- Ignoring quality: high output with high error rates isn’t a win
- Comparing different roles with the same metric: a developer and a salesperson can’t be measured the same way
- Changing the formula between reporting periods: this makes trend data meaningless
- Using unrealistic targets: targets that are impossible to hit distort the numbers and morale alike
- Ignoring workload and complexity: not all tasks take equal effort, even if they count as “one unit” each
- Treating monitoring data as productivity itself: activity trackers show presence, not performance
- Using headcount when hours worked would be more informative: especially relevant for teams with part-time or flexible schedules
How to Improve Employee Productivity After Measuring It
Identify bottlenecks
Look at where work slows down or piles up. That’s usually where the biggest gains are hiding.
Improve tools and workflows
Outdated software or clunky processes quietly eat hours every week. Fixing the tools often moves the needle more than pushing people to “work harder.”
Provide targeted training
Skill gaps show up clearly in productivity data. Training aimed at a specific gap beats generic training every time.
Clarify goals
People can’t hit targets they don’t understand. Vague goals produce vague results.
Reduce unnecessary meetings and interruptions
Fragmented time is one of the most common productivity killers, a theme that comes up constantly in workplace-management discussions on LinkedIn, where operations and HR leaders regularly share how meeting overload quietly drags down team output.
Automate repetitive work
Manual, repetitive tasks are usually the easiest place to free up real hours.
Provide feedback and coaching
Regular, specific feedback closes the gap between where someone is and where they need to be, much faster than annual reviews alone.
Support sustainable workloads
Overloaded employees produce diminishing returns and burn out. Productivity gains that come from unsustainable hours don’t last.
Track whether improvements actually change productivity
After making a change, re-measure using the same formula and time period you used originally. If the number didn’t move, the fix probably wasn’t the real problem.
Employee Productivity Formula: Quick Reference
Formula:
Employee Productivity = Output ÷ Input
Example:
240 tickets ÷ 40 hours = 6 tickets per hour
Remember: The right formula depends on the employee’s role, the output being measured, the input being used, and the quality standard applied.
Frequently Asked Questions
1. What is the formula for employee productivity?
Employee Productivity = Total Output ÷ Total Input. The specific output and input depend on the role.
2. What is an example of employee productivity?
A support agent who resolves 240 tickets in a 40-hour week has a productivity rate of 6 tickets per hour (240 ÷ 40).
3. How do you calculate productivity per employee?
Divide total output by the number of employees: Total Output ÷ Number of Employees.
4. How do you calculate labor productivity?
Divide total output by labor hours: Output ÷ Labor Hours. This is generally considered more accurate than dividing by headcount alone.
5. What is a good employee productivity rate?
There’s no universal number. A “good” rate depends on the role, industry, and quality standards. Compare against historical, team, or industry benchmarks instead of a fixed target.
6. How do you calculate employee productivity in Excel?
Set up columns for Output and Hours, then use a simple division formula like =B2/C2 to get the productivity rate.
7. What is the difference between productivity and efficiency?
Productivity measures output relative to input. Efficiency measures how well resources are used to get that output, with less waste. They’re related but not the same.
8. What are the most important employee productivity metrics?
Output per hour, task completion rate, quality/error rate, and goal attainment are among the most widely used, though the best combination depends on the role.
9. How do you measure productivity for remote employees?
Focus on output and results, completed work, deliverables, and quality, rather than hours logged or activity monitoring, which don’t reliably reflect actual productivity.
10. Can employee productivity be measured using hours worked?
Yes, and it’s one of the most common inputs used, especially in the labor productivity formula (Output ÷ Hours Worked).
11. Why should quality be included when measuring productivity?
Without a quality check, high output numbers can hide rework, errors, and customer dissatisfaction, none of which reflect real productivity.
Conclusion
The employee productivity formula itself is simple: output divided by input. What takes real judgment is picking the right output, the right input, and the right benchmark for the specific role you’re measuring. Get that part right, pair it with a quality check, and the numbers will actually tell you something useful, instead of just giving you a number that looks precise but means very little.

Mehreen Mushtaq is a skilled content writer dedicated to creating high-quality, engaging, and SEO-focused blogs. She specializes in strategic keyword usage, search intent, and informative content that connects with readers while helping websites strengthen their visibility and rankings in search results.