

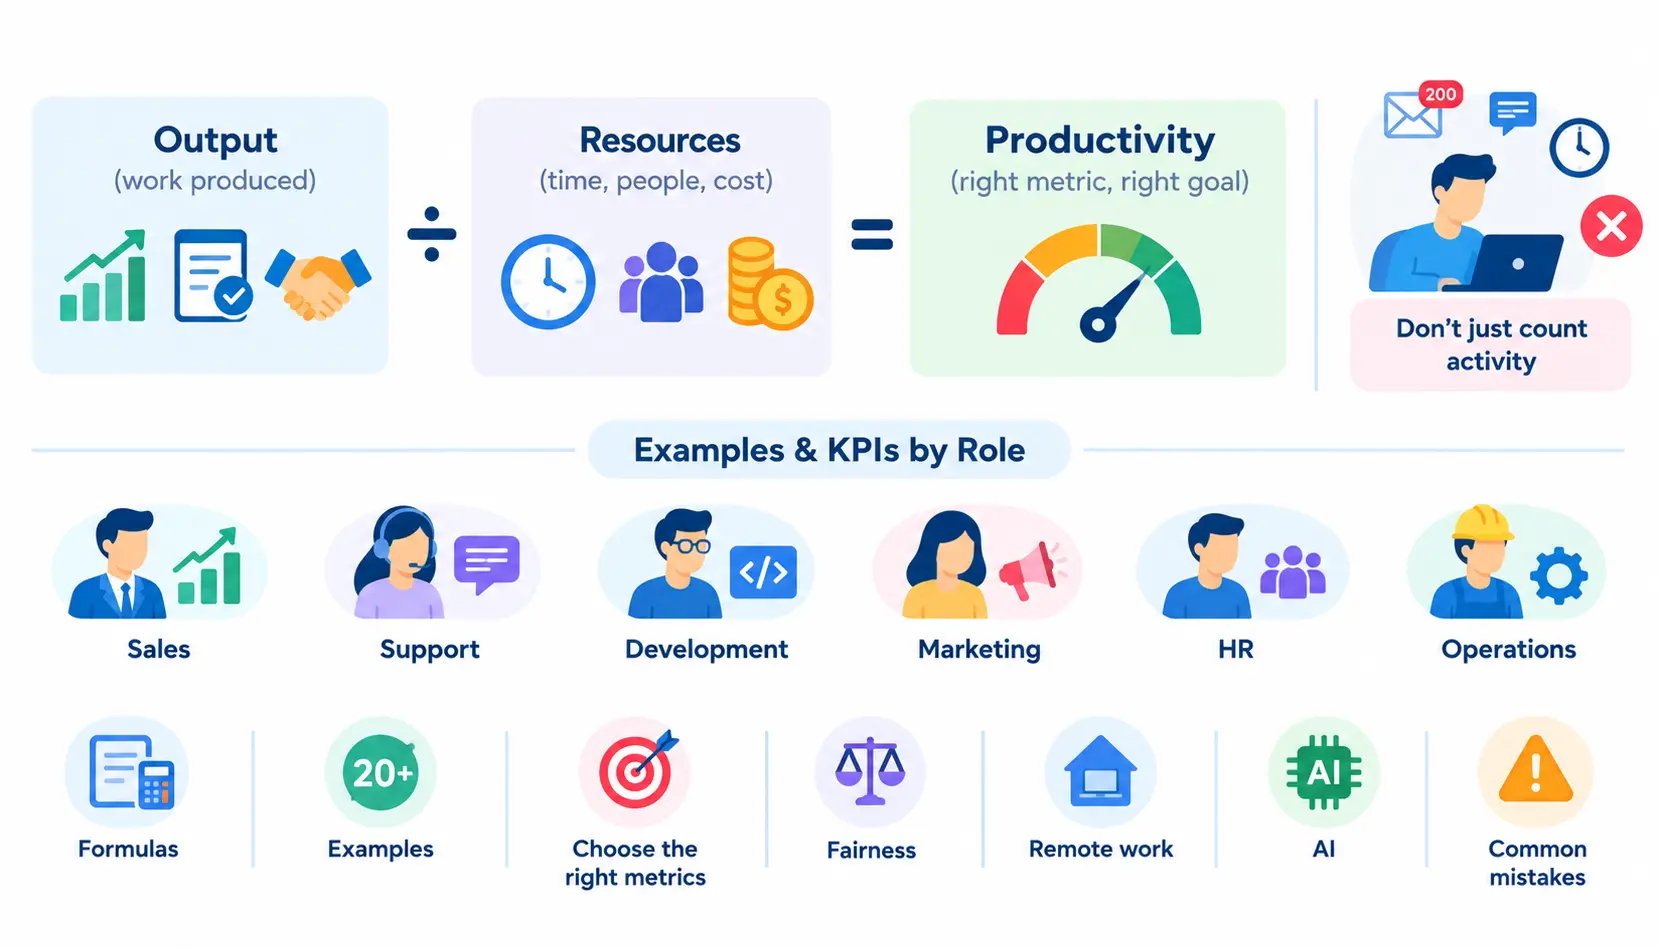
Employee productivity metrics are measurements that compare the work people produce with the resources they use to produce it. That could be revenue per employee, tickets resolved per hour, or projects delivered per quarter.
Many companies start by tracking activity: logins, emails sent, hours online. It feels objective, but it often misleads. A person who sends 200 emails a day is not necessarily more productive than one who sends 20 and closes a big deal.
This guide covers the formulas, 20 practical examples, role-specific KPIs, and a simple way to choose the right employee productivity metrics for your team. It also covers fairness, remote work, AI, and the mistakes that cause metrics to backfire.
What Are Employee Productivity Metrics?
Employee productivity metrics show how effectively people turn time, effort, and resources into useful results. The keyword is useful. Output that nobody needs, or that has to be redone, is not productive.
The idea builds on the classic economic definition of productivity: the ratio of output to input. At the workforce level, it is closely tied to labour productivity.
Employee productivity vs. performance
Productivity is about how much value you produce relative to the resources used. Performance is broader. It includes quality, behavior, collaboration, growth, and how well someone meets the expectations of the role.
Think of productivity as one input into performance. A developer may ship a lot of code (high productivity) but write buggy code and ignore feedback (weak performance).
Productivity vs. efficiency vs. utilization vs. effectiveness
These terms get mixed up constantly. Here is how they differ.
| Term | Plain-English meaning | Simple example |
| Productivity | Output relative to input | 40 tickets resolved in 8 hours |
| Efficiency | Doing the work with minimal waste | Resolving tickets with fewer handoffs |
| Utilization | Share of available time spent on target work | 30 of 40 hours are billable (75%) |
| Effectiveness | Whether the work achieves the right goal | Tickets resolved and customers satisfied |
Output vs. outcome vs. impact
- Output is what someone produces: reports written, calls made, features shipped.
- Outcome is the result of that output: more qualified leads, fewer customer complaints.
- Impact is the lasting business effect: revenue growth, higher retention.
Strong measurement connects all three. Output alone tells you people are busy. Outcome and impact tell you the work matters.
How Do You Calculate Employee Productivity?
The basic method is simple. Pick a meaningful output, pick the input used to create it, and divide.
Basic productivity formula
Productivity = Output ÷ Input
Output might be units, sales, tickets, or projects. Input might be hours, headcount, or labor cost. The trick is choosing a pair that fits the job.
Output per employee
Output per employee = Total output ÷ Number of employees
If a team of 10 completes 500 support tickets in a week, output per employee is 50 tickets. Use full-time equivalents (FTEs) if some people work part-time.
Output per hour
Output per hour = Total output ÷ Total hours worked
If an assembly team produces 960 units in 120 labor hours, output per hour is 8 units. This works best for repeatable, countable work.
Revenue per employee
Revenue per employee = Total revenue ÷ Average number of employees
A company with $12 million in revenue and 60 employees earns $200,000 per employee. It is a useful high-level benchmark, but it says little about any one person.
Productivity based on labor cost
Labor cost productivity = Value of output ÷ Total labor cost
If a team generates $500,000 in gross margin and costs $250,000 in salaries and benefits, the ratio is 2.0. Every dollar of labor produces two dollars of margin.
Why the basic productivity formula has limitations
One formula cannot fit every job. A sales rep, a software engineer, a designer, a support agent, and a manager all create value differently.
- Sales: revenue works, but deal size and cycle length vary wildly.
- Software: lines of code or commits are poor proxies for value.
- Creative work: one great idea can outweigh fifty average ones.
- Support: high ticket volume may mean the product has problems, not that agents are productive.
- Management: the output is often a team’s results, which is hard to attribute.
That is why you need a set of employee productivity metrics tailored to the role, not a single number.
Employee Productivity Metrics at a Glance
| Metric | Formula | Best for | What it tells you | Limitation |
| Revenue per employee | Revenue ÷ avg. employees | Company-level benchmarking | Overall workforce efficiency | Ignores role, margin, and industry |
| Output per hour | Units ÷ hours worked | Manufacturing, data entry | Work rate | Ignores quality |
| Task completion rate | Completed ÷ planned tasks × 100 | Project and operational teams | Reliability of delivery | Tasks vary in size |
| Planned-to-done ratio | Delivered ÷ committed work | Agile teams | Planning accuracy | Can encourage sandbagging |
| Cycle time | End date − start date | Development, operations | Speed through a process | Fast is not always good |
| Utilization rate | Billable hours ÷ available hours × 100 | Agencies, consulting | Capacity use | High rates can signal burnout |
| Focus time | Hours in uninterrupted blocks | Knowledge work | Deep-work capacity | Needs calendar data; context matters |
| Productive-time ratio | Productive time ÷ tracked time | Structured roles | Time allocation | Easy to misread; privacy concerns |
| Goal attainment | Actual ÷ target × 100 | Any goal-driven role | Progress against targets | Depends on target quality |
| Error rate | Errors ÷ total units × 100 | Finance, ops, QA | Accuracy | Needs a clear error definition |
| Rework rate | Reworked items ÷ completed items × 100 | Development, creative, ops | Hidden waste | Some iteration is healthy |
| First-contact resolution | Resolved on first contact ÷ total contacts × 100 | Customer support | Support quality | Complex issues skew results |
| Average resolution time | Total resolution time ÷ tickets resolved | Customer support | Speed of fixes | Rewards closing quickly, not correctly |
| CSAT | Positive responses ÷ total responses × 100 | Customer-facing teams | Customer sentiment | Low response rates bias results |
| Response time | Total wait ÷ number of requests | Support, sales | Responsiveness | Fast replies can be low quality |
| Meeting load | Meeting hours ÷ working hours × 100 | Hybrid and remote teams | Time cost of collaboration | Some meetings are high value |
| Collaboration metrics | Varies (e.g., cross-team interactions) | Team analysis | How work flows across people | Volume is not value |
| Engagement signals | Survey scores, eNPS | Any team | Motivation and retention risk | Self-reported; lagging |
| New-hire ramp time | Days to reach target output | Onboarding | Speed to competence | Depends on role complexity |
| AI adoption and impact | Active AI users ÷ licensed users; before/after comparisons | Teams using AI tools | Whether AI helps | Usage does not equal value |
The Most Useful Employee Productivity Metrics and Examples
Each metric below follows the same format: what it measures, formula, example, best for, and what to watch out for.
1. Revenue per employee
- What it measures: How much revenue the workforce generates on average.
- Formula: Total revenue ÷ average number of employees.
- Example: $9M revenue ÷ 45 employees = $200,000 per employee.
- Best for: Company-level trend tracking and benchmarking against similar businesses.
- Watch out for: It varies hugely by industry. Compare only with similar companies.
2. Output per hour
- What it measures: The rate at which work gets done.
- Formula: Units produced ÷ hours worked.
- Example: A billing team processes 300 invoices in 60 hours, or 5 per hour.
- Best for: Repeatable, countable tasks.
- Watch out for: Speed without quality creates rework. Always pair it with an accuracy metric.
3. Task completion rate
- What it measures: The share of planned tasks that get finished.
- Formula: (Completed tasks ÷ planned tasks) × 100.
- Example: A team plans 40 tasks and finishes 34, so the rate is 85%.
- Best for: Teams with clearly defined task lists.
- Watch out for: Not all tasks are equal. Ten trivial tasks can hide one critical miss.
4. Planned-to-done ratio
- What it measures: How reliably a team delivers what it committed to.
- Formula: Work delivered ÷ work committed.
- Example: A sprint commits to 30 story points and delivers 24, a ratio of 0.8.
- Best for: Agile and project-based teams.
- Watch out for: If teams are punished for missing, they will commit to less. Use it to improve planning, not to pressure people.
5. Cycle time
- What it measures: How long work takes from start to finish. See the general concept of cycle time.
- Formula: Completion date − start date (averaged across items).
- Example: Bug fixes average 3.5 days from “in progress” to “deployed.”
- Best for: Software, operations, and any workflow with defined stages.
- Watch out for: Shorter is not always better. Look at the quality alongside it.
6. Employee utilization rate
- What it measures: How much of someone’s available time goes to target work, often billable work.
- Formula: (Billable or target hours ÷ available hours) × 100.
- Example: A consultant works 30 billable hours out of 40 available, or 75%.
- Best for: Agencies, consulting firms, professional services.
- Watch out for: Pushing utilization toward 100% leaves no room for learning, admin work, or surprises. Sustained high utilization often precedes burnout.
7. Focus time
- What it measures: Time spent in uninterrupted blocks for deep work.
- Formula: Total hours in uninterrupted calendar blocks (for example, 2+ hours) per week.
- Example: An analyst gets 9 hours of focus time per week, down from 14 last quarter.
- Best for: Knowledge workers such as writers, engineers, and analysts.
- Watch out for: Define “focus time” consistently. Calendar data shows availability, not whether the time was actually used well.
8. Productive-time ratio
- What it measures: The share of working time spent on work-related activity.
- Formula: (Productive time ÷ total tracked time) × 100.
- Example: A data-entry role logs 6.5 productive hours in an 8-hour day, or about 81%.
- Best for: Highly structured roles where activity maps clearly to output.
- Watch out for: This is the metric most likely to feel like surveillance. Use it at team level, be transparent, and never treat it as a stand-alone performance score.
9. Goal attainment
- What it measures: Progress against agreed targets, such as OKRs or quotas.
- Formula: (Actual result ÷ target) × 100.
- Example: A rep with a $400K quota who closes $340K is at 85%.
- Best for: Any role with clear, measurable goals.
- Watch out for: Weak or unrealistic targets make this number meaningless.
10. Error rate
- What it measures: How often work contains mistakes.
- Formula: (Number of errors ÷ total units of work) × 100.
- Example: 12 incorrect entries in 800 records equals 1.5%.
- Best for: Finance, operations, data work, and quality assurance.
- Watch out for: Define what counts as an error, or teams will argue about the number instead of fixing the problem.
11. Rework/reopen rate
- What it measures: How much finished work has to be redone.
- Formula: (Reworked or reopened items ÷ completed items) × 100.
- Example: 18 of 150 closed tickets are reopened, a 12% reopen rate.
- Best for: Support, software development, creative review cycles.
- Watch out for: Some iteration is healthy, especially in creative work. Track the trend, not just the number.
12. First-contact resolution
- What it measures: The share of customer issues solved in the first interaction. Also called first-call resolution in call centers.
- Formula: (Issues resolved on first contact ÷ total issues) × 100.
- Example: 720 of 1,000 issues are solved right away, giving 72%.
- Best for: Customer support and service desks.
- Watch out for: Complex products naturally have lower rates. Compare against your own baseline.
13. Average resolution time
- What it measures: How long it takes to fully resolve an issue.
- Formula: Total resolution time ÷ number of issues resolved.
- Example: 400 tickets take a combined 1,600 hours, an average of 4 hours.
- Best for: Support and IT teams.
- Watch out for: Agents may close tickets too early to lower the number. Pair it with reopen rate and CSAT.
14. Customer satisfaction
- What it measures: How customers feel about an interaction or product. See customer satisfaction.
- Formula: (Satisfied responses ÷ total responses) × 100. Many teams count 4 and 5 on a 5-point scale as satisfied.
- Example: 180 of 200 survey responses are positive, so CSAT is 90%.
- Best for: Any customer-facing role.
- Watch out for: Small or self-selected samples can distort the score.
15. Response time
- What it measures: How quickly someone replies to a request.
- Formula: Total time to first response ÷ number of requests.
- Example: A sales team replies to inbound leads in 22 minutes on average.
- Best for: Support, sales development, account management.
- Watch out for: A fast but useless reply helps no one. Measure helpfulness too.
16. Meeting load
- What it measures: The share of working time spent in meetings.
- Formula: (Meeting hours ÷ total working hours) × 100.
- Example: A manager spends 22 of 40 hours in meetings, or 55%.
- Best for: Hybrid and remote teams that want to protect focus time.
- Watch out for: Managers legitimately spend more time in meetings than individual contributors.
17. Collaboration metrics
- What it measures: How work and communication flow between people and teams.
- Formula: Varies. Common examples include cross-team interactions per person or response patterns on shared work.
- Example: A product team’s engineers rarely interact with design, which correlates with more late-stage rework.
- Best for: Diagnosing team dynamics and silos.
- Watch out for: More collaboration is not always better. Use these as diagnostic signals, not targets.
18. Employee engagement signals
- What it measures: Motivation, commitment, and retention risk.
- Formula: Survey scores, or eNPS = % promoters − % detractors. See employee engagement.
- Example: 50% promoters and 20% detractors gives an eNPS of +30.
- Best for: Spotting early trouble before it shows up in output.
- Watch out for: Engagement is a leading indicator, not a productivity number. Do not tie it directly to individual pay or ranking.
19. New-hire productivity ramp time
- What it measures: How long it takes a new employee to reach expected output.
- Formula: Days from start date until the employee reaches a set benchmark, such as 80% of a tenured peer’s output.
- Example: New support agents reach 80% of team-average resolution rate in 45 days.
- Best for: Evaluating onboarding and hiring quality.
- Watch out for: Role complexity varies. Set the benchmark per role.
20. AI tool adoption and AI-assisted productivity
- What it measures: How much employees use AI tools and whether those tools improve results.
- Formula: Adoption = active AI users ÷ licensed users × 100. Impact = compare cycle time, output, and quality before and after adoption.
- Example: 70% of licensed writers use an AI assistant weekly, and average draft turnaround dropped from 3 days to 2, with no rise in edit rounds.
- Best for: Teams rolling out AI tools.
- Watch out for: High usage is not the same as high value. Always check quality and rework.
Employee Productivity Metrics by Role
Different jobs create value in different ways. Here are practical metric sets by function.
Sales productivity metrics
- Revenue per rep: total sales ÷ number of reps
- Deals closed: count of won deals in a period
- Conversion rate: (deals won ÷ qualified opportunities) × 100
- Pipeline-to-close ratio: closed revenue ÷ pipeline created
- Average deal size: total revenue ÷ deals won
- Customer retention: (customers kept ÷ customers at start) × 100
Customer service productivity metrics
- Tickets resolved per agent per day or week
- Resolution time (average and median)
- First-contact resolution
- CSAT
- Reopen rate
Median resolution time is often more honest than the average, because a few extreme cases can skew the mean.
Software development productivity metrics
- Cycle time from first commit to production
- Deployment frequency
- Tasks or features completed
- Defect rate
- Rework
- Review time (how long code waits for review)
For a well-researched framework, see the DORA research program, which focuses on delivery speed and stability together. Avoid counting lines of code or commits as productivity. They reward volume, not value.
Marketing productivity metrics
- Qualified leads generated
- Campaign output (assets shipped on time)
- Conversion rate by channel
- Cost per lead: marketing spend ÷ leads
- Campaign ROI: (revenue attributed − cost) ÷ cost × 100
HR productivity metrics
- Time-to-fill: days from job posting to accepted offer
- Hires completed against plan
- Onboarding completion rate
- Retention of new hires
- Cost per hire: total recruiting costs ÷ hires
Operations and manufacturing productivity metrics
- Units per hour
- Throughput: total units completed in a set time
- Defect rate
- Downtime: time equipment or lines are not running
- Cost per unit: total production cost ÷ units produced
For equipment-heavy environments, Overall Equipment Effectiveness combines availability, performance, and quality into one measure.
Knowledge-worker productivity metrics
- Focus time
- Cycle time for projects and deliverables
- Goal attainment
- Project completion rate
- Quality (peer review scores, revision rounds)
- Collaboration patterns
Knowledge work is hard to count, so lean on goals, quality, and time protected for deep work.
How to Choose the Right Employee Productivity Metrics
The best set of employee productivity metrics is small, specific, and connected to a real business goal. Work through the steps below.
Start with the business outcome
Ask what you are trying to improve: revenue, customer retention, delivery speed, cost, or quality. Every metric should trace back to that answer.
Define meaningful output for the role
Ask what the role produces that someone else values. For a recruiter, it is filled roles. For a support agent, it solves problems.
Identify the appropriate input
Choose the resource that best reflects effort or cost: hours, headcount, or labor cost. Use hours for hourly, repeatable work and FTEs or cost for broader comparisons.
Add a quality metric
Every output metric needs a quality partner. Volume without accuracy just moves problems downstream.
Add an outcome or impact metric
Output shows activity. Outcome shows results. Pair “demos delivered” with “demos that become deals,” for example.
Limit the KPI set
Three to five well-chosen KPIs per role are usually enough. More than that dilutes focus, and people cannot act on ten numbers at once.
Document every metric definition
Write down the formula, data source, owner, and review frequency for each metric. If two managers calculate “resolution time” differently, the numbers are useless.
A simple metric-selection decision tree
- What are you trying to improve? (e.g., customer retention)
- What work creates that result? (e.g., resolving issues quickly and correctly)
- What output proves progress? (e.g., first-contact resolution rate)
- What quality measure protects against gaming? (e.g., CSAT and reopen rate)
If you cannot answer step 4, the metric is not ready to use.
Why You Should Use Multiple Productivity Metrics
The problem with single-KPI measurement
When you measure only one thing, people optimize for it, often at the expense of everything else. This pattern is described by Goodhart’s law: when a measure becomes a target, it stops being a good measure.
Pair output with quality
If you track tickets closed, also track reopen rate. If you track code shipped, also track defects.
Pair speed with customer outcomes
Fast response times mean little if customers leave unhappy. Pair speed with CSAT or resolution quality.
Pair utilization with workload
A high utilization rate can look great on a dashboard while the team quietly burns out. Add workload or engagement signals alongside it.
Pair individual metrics with team metrics
Individual numbers show contribution. Team numbers show whether people are helping each other. Using only individual metrics can discourage collaboration.
Metric-pairing table
| Primary metric | Pair it with | Why |
| Output per hour | Error rate | Speed should not sacrifice accuracy |
| Tickets resolved | Reopen rate, CSAT | Closing is not solving |
| Deals closed | Retention, deal quality | Prevents short-term selling |
| Utilization rate | Engagement, workload | Protects against burnout |
| Cycle time | Defect rate | Fast delivery must be stable |
| Response time | CSAT | Fast replies must be helpful |
| Individual goal attainment | Team goal attainment | Encourages cooperation |
How to Measure Productivity Without Measuring Hours Alone
Why hours worked are an input, not an outcome
Hours tell you how much time someone spent. They do not tell you what was achieved. Two people can work eight hours and produce very different results.
When time-based metrics are useful
Time-based measures make sense for repeatable work, billing, capacity planning, and staffing. Call centers and manufacturing lines are good examples.
When time tracking becomes misleading
For creative or analytical work, time spent often has a weak link to value. A strong solution might take an hour of thinking, while a weak one takes a week. Tracking hours can also push people to look busy instead of doing meaningful work.
Measuring knowledge work
Use a mix of goal attainment, project milestones, peer or manager quality reviews, and protected focus time. Agree on what “done well” looks like before the work begins.
Measuring creative and collaborative work
Focus on deliverables reached, revision rounds, stakeholder satisfaction, and the outcomes the work supports. For example, a design team might track how many concepts pass review without major changes, alongside the impact of the launched design.
How to Measure Employee Productivity Fairly
Unfair measurement damages trust faster than no measurement at all. Keep these principles in mind.
Compare employees doing comparable work
Never rank a senior enterprise sales rep against a junior SMB rep on deal count. Group people by role, level, and type of work.
Normalize for FTE and working hours
A part-time employee working 20 hours should not be compared with a full-timer’s raw output. Use output per hour or per full-time equivalent.
Account for workload and complexity
Ten simple tickets are not the same as ten complex ones. Weight work by difficulty where you can, or segment by category.
Account for seasonality
Retail teams in December and accountants in tax season work under very different conditions than in quieter months. Compare against the same period last year when possible.
Consider tenure and ramp-up
New hires need time to reach full output. Judge them against ramp-up expectations, not veteran benchmarks.
Avoid individual rankings based on one KPI
Ranking people by a single number invites gaming and resentment. Use several metrics, add manager context, and treat the data as a conversation starter.
How to Measure Productivity for Remote and Hybrid Teams
The same principle applies: measure results, not presence. Here is what works.
Focus time
Track how much uninterrupted time people get. It is a leading indicator for deep work and often the first thing to erode in remote setups.
Meeting load
A growing meeting load can quietly crowd out productive work. Review it monthly and cut recurring meetings that no longer serve a purpose.
Collaboration
Look at how work flows across teams. Slow handoffs or isolated groups often show up before output drops.
Goal attainment
Clear goals with regular check-ins do more for remote productivity than any monitoring tool.
Output and quality
Measure deliverables and their quality, exactly as you would for an in-office team.
What not to use as a proxy for productivity
Avoid these:
- Green “active” status indicators
- Keystrokes or mouse movement
- Hours logged in
- Email or chat message counts
- Screenshots
These signal activity, not results, and they erode trust quickly.
How AI Is Changing Employee Productivity Metrics
AI tools are changing how work gets done, which means some traditional metrics are losing meaning. Workforce analytics vendors and HR platforms, including Worklytics and HiBob, now discuss AI as a growing part of modern productivity and performance measurement.
Why task counts are becoming less informative
When AI can draft, summarize, or code in seconds, “number of tasks completed” can rise sharply without real gains in value. Counting tasks alone rewards volume.
AI-assisted output
Measure what AI changes: turnaround time, throughput, and how much more time people have for higher-value work. Compare the same type of work before and after adoption.
Review and rework
AI output often needs checking. Track how much time goes into review and correction. If rework grows, apparent speed gains may be an illusion.
Quality after AI adoption
Watch error rates, customer satisfaction, and peer review scores. Faster output that lowers quality is a bad trade.
AI tool adoption
Track how many people actually use the tools and how often. Low adoption might mean poor fit, weak training, or trust concerns.
Measuring outcomes instead of AI activity
Do not reward people for using AI. Reward the results: faster delivery, better quality, happier customers. Prompts sent or minutes in an AI tool prove nothing about value.
How to Build an Employee Productivity KPI Dashboard
A good dashboard makes decisions easier. A bad one just adds noise.
What to include
For each KPI, show:
- KPI name and definition
- Current value
- Baseline (where you started)
- Target
- Previous period
- Trend (up, down, flat)
- Quality indicator paired with it
- Context (for example, “two team members on leave”)
Context matters. A dip that has an obvious cause needs a different response than an unexplained one.
Team-level vs. individual dashboards
Team dashboards are best for spotting patterns and process problems. Individual dashboards are more sensitive. If you use them, share them openly with the employee and use them for coaching, not surprise judgments.
How many KPIs should you track?
Five to eight per team is a sensible range. If nobody can name the top three without looking, you probably have too many.
How often should you review them?
Match the review rhythm to how fast the metric changes. Operational numbers may need daily or weekly checks, while strategic ones fit monthly or quarterly reviews (see the schedule below).
Where Does Employee Productivity Data Come From?
You rarely need new tools. Most data already lives in systems you use.
- HRIS/HCM systems: headcount, tenure, FTE status, time off
- Project management systems: task status, cycle time, planned-to-done ratios
- CRM systems: deals, pipeline, conversion rates, revenue
- Customer support platforms: tickets, resolution time, FCR, CSAT
- Time-tracking systems: hours, billable time, utilization
- Code repositories: pull requests, review time, deployment data
- Surveys and performance systems: engagement, goal progress, feedback
- Workforce analytics platforms: tools such as Worklytics combine signals from calendars, email, chat, video calls, project systems, and code repositories to show collaboration and work patterns
Whichever sources you use, be transparent with employees about what you collect and why. Check local privacy and employment regulations before analyzing communication data.
Common Employee Productivity Measurement Mistakes
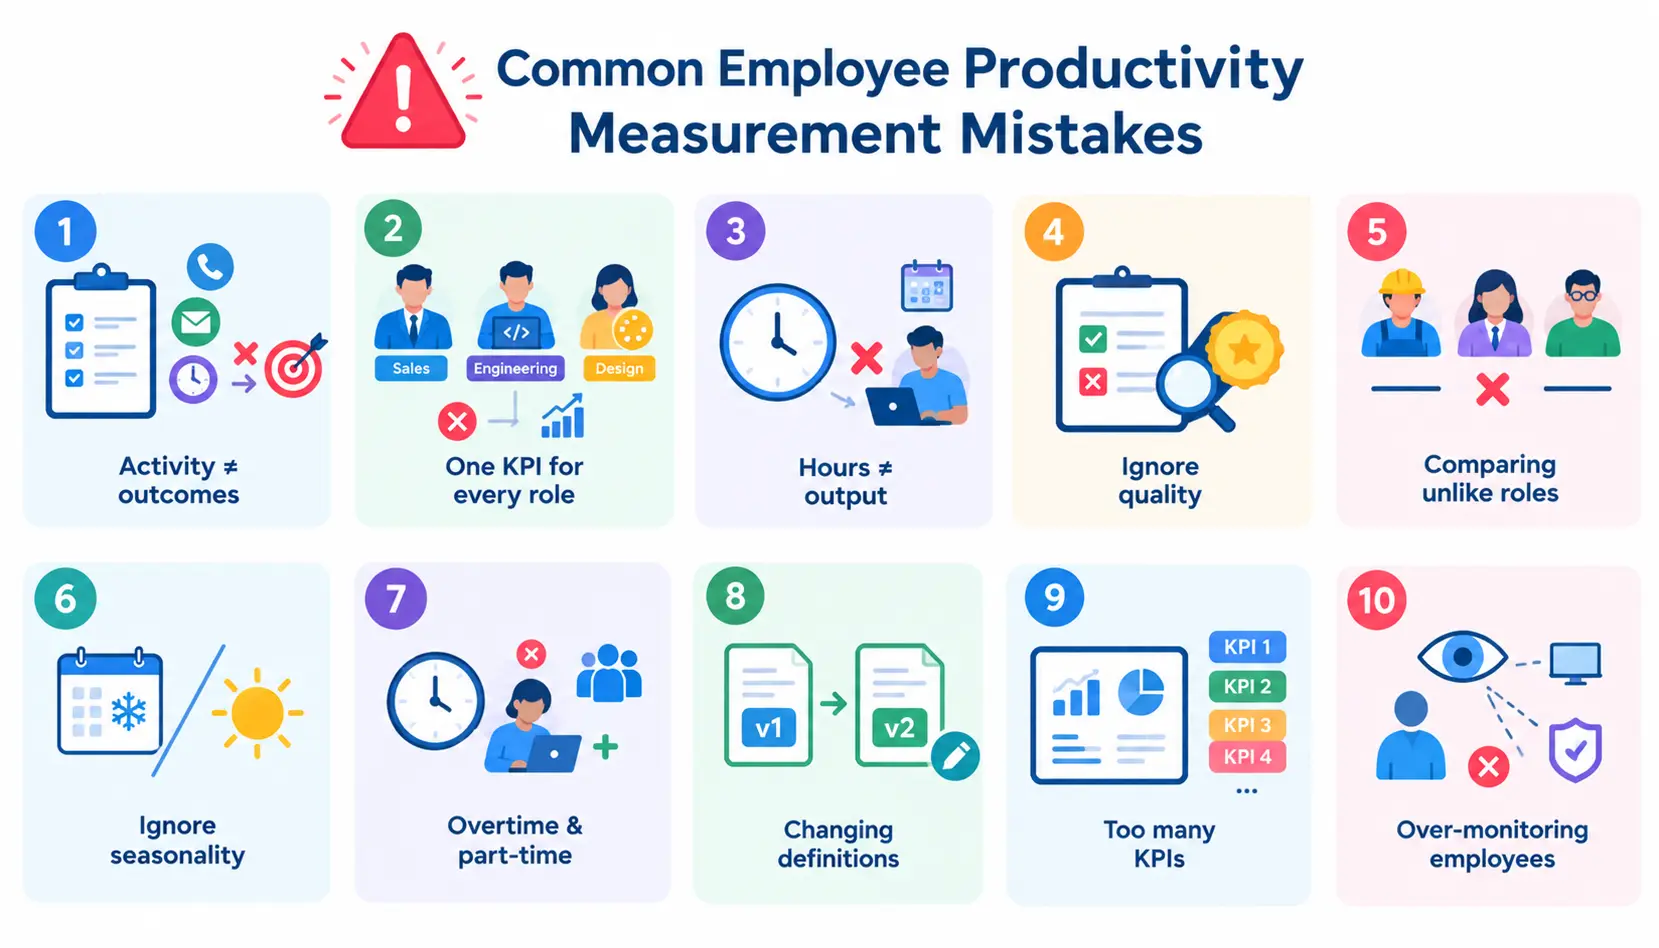
Measuring activity instead of outcomes. Calls made, emails sent, and hours online show effort, not results. Focus on what the activity produces.
Using one KPI for every role. A metric that suits sales will fail for engineering. Build role-specific sets.
Measuring hours instead of output. Time in the seat rewards presence. Results reward value.
Ignoring quality. Speed and volume without accuracy create hidden costs downstream.
Comparing unlike roles. Rankings across different jobs, levels, or markets are rarely fair.
Ignoring seasonality. A quiet-month dip may be perfectly normal.
Ignoring overtime and part-time work. Raw output comparisons can mislead when working hours differ. Normalize by hours or FTE.
Changing metric definitions. If the formula changes every quarter, trends become meaningless. Version and document changes.
Tracking too many KPIs. More metrics do not mean more insight. They mean less focus.
Over-monitoring employees. Heavy surveillance damages trust and often lowers morale without improving results. Measure outcomes, be open about methods, and respect privacy.
How to Interpret Employee Productivity Metrics
Collecting the numbers is the easy part. Reading them well takes judgment.
Look at trends, not isolated numbers
One bad week means little. Three months of decline means something. Track direction over time.
Compare against a baseline
Set a baseline before you make changes, so you know whether an improvement is real.
Compare like-for-like teams
Compare teams with similar work, size, and conditions. Otherwise you are comparing circumstances, not performance.
Investigate unexpected changes
If a metric jumps or drops suddenly, look for causes: a process change, new tool, staffing gap, or a definition change.
Look for conflicting metrics
When two related metrics move in opposite directions, dig deeper. That is often where the real story is.
Turn metrics into operational decisions
A metric that does not lead to a decision is just decoration. Ask what you will do differently based on it.
Example: Output increased but quality decreased
A support team’s tickets per agent rose 15%, but the reopen rate climbed from 8% to 14%. Agents are likely closing tickets too fast. The fix might be coaching, better knowledge-base articles, or removing pressure to hit volume quotas.
Example: Focus time decreased but output stayed stable
Output holds for now, but the team is working harder to stay level. Watch for burnout, missed deadlines, or quality slipping in the following months. Review the meeting calendar early.
Example: Utilization increased while burnout signals increased
Higher utilization looks efficient, but rising engagement risks and overtime suggest the team is over capacity. Add headcount, cut scope, or reprioritize before people leave.
How Often Should You Review Productivity Metrics?
Daily operational metrics. Fast-moving numbers such as ticket queues, production output, and response times suit daily checks by team leads.
Weekly team metrics. Task completion, planned-to-done ratio, and cycle time work well in weekly team reviews.
Monthly business metrics. Revenue per employee, conversion rates, quality trends, and meeting load fit monthly reviews with managers and leadership.
Quarterly KPI review. Step back and ask whether the KPIs still match the business goals. Retire metrics that no longer drive decisions, and adjust targets.
Employee Productivity Metrics vs. Employee Performance Metrics
Productivity metrics answer, “How much value are we producing relative to what we put in?” Performance metrics answer a wider question: “How well is this person doing in their role overall?”
| Productivity metrics | Performance metrics | |
| Focus | Output relative to input | Overall contribution and behavior |
| Examples | Output per hour, cycle time, revenue per employee | Goal attainment, competencies, peer feedback, manager reviews |
| Typical timeframe | Continuous, short cycles | Periodic reviews |
| Scope | Mostly quantitative | Quantitative and qualitative |
Productivity data is one important input into a fair performance review. It should never be the only one.
Frequently Asked Questions About Employee Productivity Metrics
1. What are employee productivity metrics?
Employee productivity metrics are measurements that compare the work employees produce with the time, effort, or cost used to produce it. Examples include output per hour, cycle time, revenue per employee, and first-contact resolution.
2. What is the best employee productivity metric?
There is no single best metric. The right one depends on the role and business goal. Choose an output metric that fits the work, and always pair it with a quality metric.
3. How do you calculate employee productivity?
Divide output by input: Productivity = Output ÷ Input. For example, if a team completes 300 tasks in 150 hours, productivity is 2 tasks per hour.
4. What are the five most important productivity KPIs?
For most teams, a strong starting five is output per hour (or per FTE), cycle time, goal attainment, error or rework rate, and a customer or stakeholder satisfaction score. Adjust them to the role.
5. How do you measure productivity without tracking hours?
Measure results instead. Use goal attainment, completed deliverables, quality reviews, and outcome metrics such as customer satisfaction or revenue contribution.
6. How do you measure productivity for remote employees?
Use the same outcome-based metrics you use in the office: goals, output, and quality. Add focus time and meeting load as context. Avoid activity proxies like keystrokes or online status.
7. How do you measure knowledge-worker productivity?
Combine goal attainment, project completion, quality feedback, cycle time, and protected focus time. Agree in advance on what a good result looks like.
8. What is the difference between productivity and efficiency?
Productivity measures how much output you get from a given input. Efficiency measures how little waste occurs in producing it. A team can be efficient (few wasted steps) yet not productive if it works on the wrong things.
9. How many productivity metrics should a company track?
Three to five KPIs per role and five to eight per team is a practical range. Track enough to see quality and outcomes, but not so many that people lose focus.
10. Can AI measure employee productivity?
AI-powered analytics can surface patterns in work data, but they cannot judge value on their own. Human context is still needed to interpret results fairly. Also remember that AI tools change what you should measure, as covered above.
11. How can companies prevent employees from gaming productivity metrics?
Pair every output metric with a quality metric, use several KPIs instead of one, keep definitions transparent, and avoid tying a single number to pay or rankings. Review metrics regularly to catch unintended behavior early.
Conclusion
Employee productivity metrics work best when they measure results, not busyness. Start with the business outcome, choose an output that fits the role, add a quality check, and keep the KPI set small.
Use the numbers to understand and support your team, not to catch people out. Look at trends, compare like with like, and always add context. Done well, employee productivity metrics help you spot problems early, back good work, and make better decisions about people and process.

Mehreen Mushtaq is a skilled content writer dedicated to creating high-quality, engaging, and SEO-focused blogs. She specializes in strategic keyword usage, search intent, and informative content that connects with readers while helping websites strengthen their visibility and rankings in search results.