

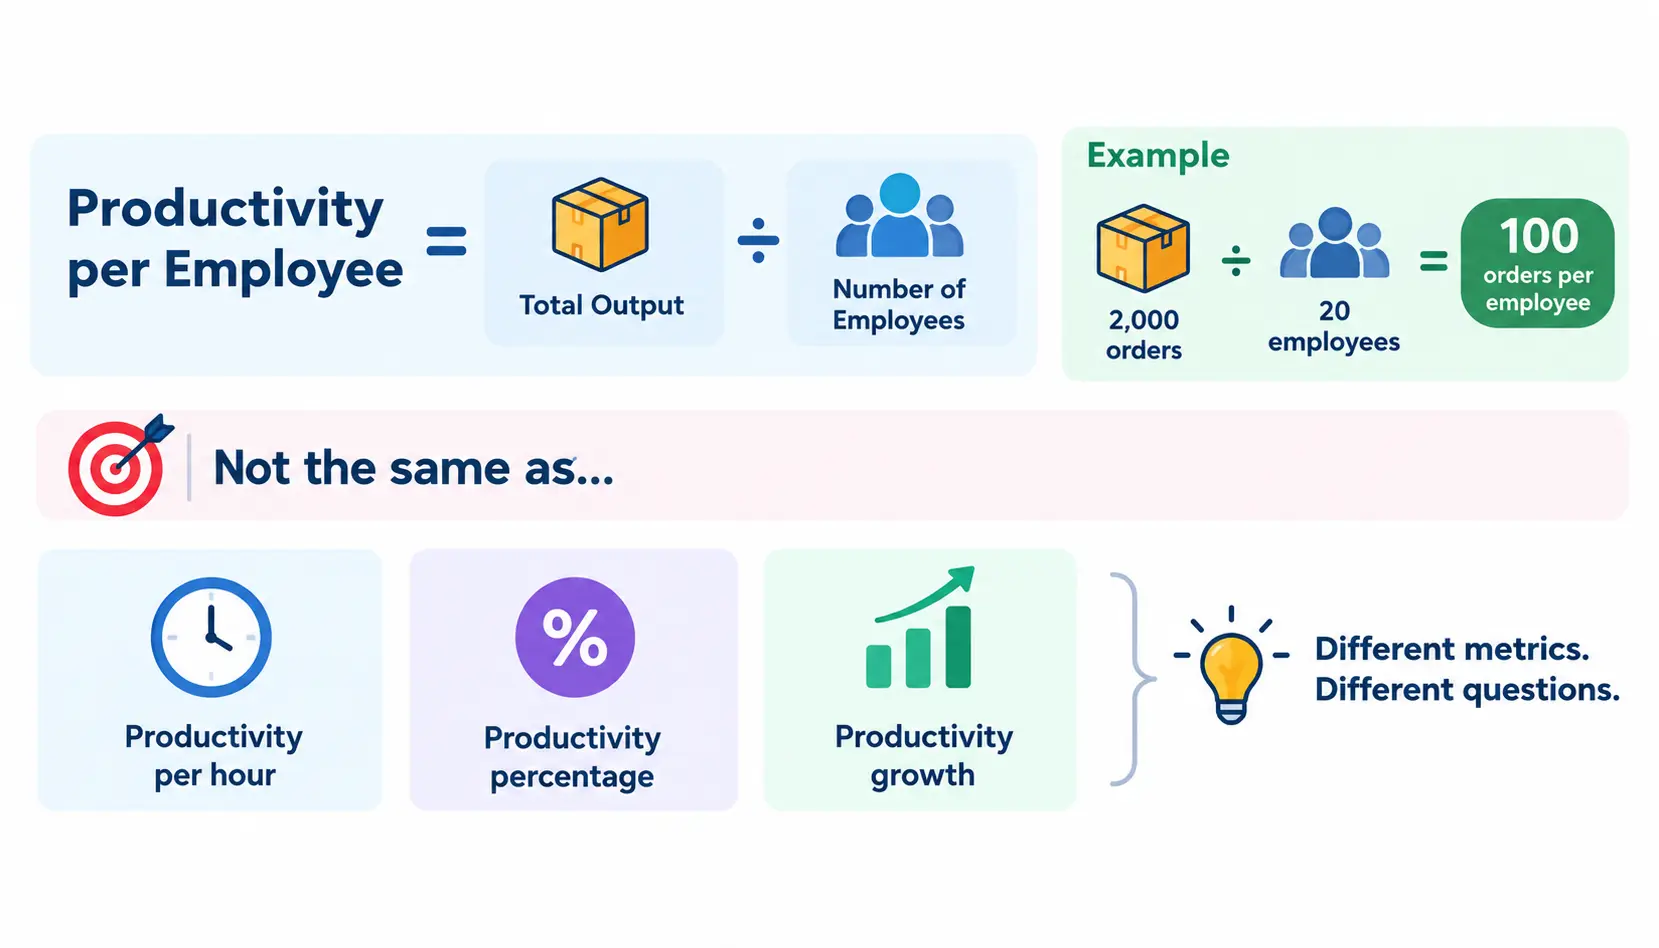
Productivity per employee = total output ÷ number of employees.
If your team completed 2,000 orders with 20 employees, the result is 2,000 ÷ 20 = 100 orders per employee.
That is the quick answer. But productivity per employee is not the same as productivity per hour, productivity percentage, or productivity growth. Each one answers a different question, and mixing them up is the most common reason people get misleading numbers.
This guide shows you which formula to use, how to run the math step by step, how to do it in Excel, and how to read the result without fooling yourself.
How Do You Calculate Productivity per Employee?
Productivity per employee tells you how much output your business produces for each person on the team. It is the simplest productivity measure, which is why it is a good starting point.
Productivity per employee formula
Productivity per employee = Total output ÷ Number of employees
“Output” is whatever your team produces: orders shipped, tickets closed, revenue earned, projects finished. Pick one and stick with it.
Simple example
- Total output: 2,000 orders
- Number of employees: 20
- Calculation: 2,000 ÷ 20
- Result: 100 orders per employee
What the result tells you, and what it does not
The result is average. It says that, across the team, each person accounts for 100 orders. It does not say every person handled 100 orders.
One employee might have processed 180 while another processed 40. The average hides that gap. So use this number to track a team or business over time. Do not use it to grade one individual.
What Is Employee Productivity?
Employee productivity is the relationship between what people produce (output) and what it takes to produce it (input). In economics, productivity is generally defined as output relative to input.Wikipedia’s overview of productivity is a useful plain-language reference.
Output
Output is the result of the work. Depending on the role, it can be:
- Units produced
- Orders processed
- Tasks completed
- Tickets resolved
- Revenue generated
- Deals closed
- Projects delivered
Input
Input is what you spend to get that output. Common inputs include:
- Number of employees
- Hours worked
- Labor cost
- Materials
- Capital and equipment
Why there is no single productivity formula
A warehouse, a law firm, and a software team do not create value the same way. Counting “units” makes sense in a factory and very little sense in a consulting practice.
So the right formula depends on four things: the role, the industry, how you define output, and what you are trying to learn. Pick the formula that fits your goal, not the one that is easiest to calculate.
The Main Employee Productivity Formulas
Here are the formulas you will use most often.
Productivity per employee
Output ÷ number of employees
Best for a quick, high-level view of a team or company.
Labor productivity per hour
Output ÷ hours worked
Best when people work different schedules. It corrects for part-timers and overtime.
Revenue per employee
Revenue ÷ number of employees
A common company-level measure. Investors and leaders often use it to compare businesses in the same industry.
Productivity percentage
Actual output ÷ target output × 100
If the target was 100 units and you made 90, productivity is 90%.
Productivity change
(New productivity − old productivity) ÷ old productivity × 100
If productivity moved from 100 to 110 orders per employee, the change is (110 − 100) ÷ 100 × 100 = 10% growth.
Productivity index
Current productivity ÷ base-period productivity × 100
Using the same numbers: 110 ÷ 100 × 100 = an index of 110. That means productivity is 10% above the base period, which is set at 100.
Multifactor productivity
Output ÷ combined inputs
This compares output with several inputs at once, such as labor, capital, and materials. The U.S. Bureau of Labor Statistics publishes multifactor productivity data for this purpose. For most businesses it is more than you need, but it is good to know it exists.
Productivity per Employee vs Productivity per Hour
These two get confused constantly. Here is how they differ.
| Metric | Formula | What it answers |
| Per employee | Output ÷ employees | How much output per person? |
| Per hour | Output ÷ hours | How much output per labor hour? |
| Revenue per employee | Revenue ÷ employees | How much revenue per person? |
| Target percentage | Actual ÷ target × 100 | How much of the goal was achieved? |
When to use each formula
- Use per employee when everyone works similar hours and you want a simple snapshot.
- Use per hour when you have part-time staff, shift differences, or overtime.
- Use revenue per employee for company-level comparisons or benchmarking against similar businesses.
- Use target percentage when you have clear goals, like a monthly quota.
- Use productivity change when you want to show improvement or decline between two periods.
A simple rule: if hours vary a lot between people, go with per hour. Headcount treats a 10-hour-a-week part-timer the same as a full-timer.
How to Calculate Employee Productivity Step by Step
Follow these seven steps and you will avoid most errors.
Step 1: Define the output
Decide exactly what counts. “Tickets resolved” is clear. “Work done” is not. Write the definition down so it stays the same next month.
Step 2: Choose the input
Pick employees, hours, or cost. If schedules differ, hours are usually more accurate.
Step 3: Set the measurement period
Use a fixed window, such as one week or one month. Comparing a 4-week month to a 5-week month will distort your results.
Step 4: Make the units consistent
Do not divide monthly output by weekly hours. If you count full-time and part-time staff, convert to full-time equivalents (FTE). FTE simply converts total hours worked into the number of full-time workers.
Step 5: Apply the formula
Divide output by input. Keep the units in your answer, such as “orders per employee” or “tickets per hour.”
Step 6: Compare with a baseline
A number alone means little. Compare it with last quarter, last year, or a target.
Step 7: Check quality and context
Ask whether quality held steady. A team that closes more tickets by rushing may be less productive in reality if customers keep coming back with the same problem.
Employee Productivity Calculation Examples
Manufacturing example
A plant produces 4,800 units in a week. Workers logged 1,200 labor hours.
4,800 ÷ 1,200 = 4 units per labor hour
Customer service example
A support team resolves 900 tickets in 300 hours worked.
900 ÷ 300 = 3 tickets per hour
Sales example
A sales team of 10 brings in $1,500,000 in revenue.
$1,500,000 ÷ 10 = $150,000 revenue per employee
You can also count qualified deals instead of revenue if pricing varies a lot between deals.
Software development example
Avoid counting lines of code. More code is not better code. Track outcomes instead, such as features shipped, bugs resolved, or work items completed per sprint, then divide by team capacity or hours.
Healthcare example
A clinic completes 600 patient visits in a month with 12 clinical staff.
600 ÷ 12 = 50 visits per employee
If some staff are part-time, use hours or FTE for a fairer figure.
Professional services example
A consulting firm bills $600,000 in a quarter with 8 consultants.
$600,000 ÷ 8 = $75,000 billable revenue per consultant
How to Calculate Productivity per Employee in Excel
Excel makes this quick, and it scales as your data grows. If you get stuck on a formula, communities like r/excel are a practical place to ask.
Set up the spreadsheet
Create these columns:
| Employee | Output | Hours Worked | Output/Hour | Output/Employee |
| Employee A | 40 | 8 | ||
| Employee B | 30 | 2 |
Excel formula for productivity per employee
=Output/Employees
In cell terms, if total output is in B10 and headcount is in B11: =B10/B11
Excel formula for productivity per hour
=Output/Hours
For example: =B2/C2
Excel formula for productivity percentage
=Actual/Target*100
Excel formula for productivity change
=(New-Old)/Old*100
How to aggregate a team correctly
Do not simply average individual productivity rates. Use total output ÷ total input instead.
Here is why. Say Employee A makes 40 units in 8 hours (5 per hour) and Employee B makes 30 units in 2 hours (15 per hour).
- Averaging the rates: (5 + 15) ÷ 2 = 10 per hour. This is wrong.
- Using totals: 70 units ÷ 10 hours = 7 per hour. This is right.
The average of rates overweights the person who worked fewer hours. In Excel: =SUM(B2:B6)/SUM(C2:C6).
How to Measure Productivity for Different Types of Employees
Match the metric to the work.
Manufacturing employees
Units produced per labor hour is the standard. Add defect rate so speed does not come at the cost of quality.
Sales employees
Use revenue, qualified deals, or pipeline created. Compare people with similar territories and deal sizes.
Customer service employees
Tickets resolved per hour works well. Pair it with customer satisfaction and first-contact resolution.
Developers and technical teams
Measure completed outcomes, such as shipped features or resolved issues. Avoid lines of code, commit counts, or hours online.
Marketing teams
Look at results tied to goals: qualified leads, campaign output, or conversions. Volume of content alone rarely tells the full story.
Administrative employees
Track completed tasks, processing time, and error rates for repeatable work such as invoicing or scheduling.
Knowledge workers
Task counts can mislead here. One person may finish five simple tasks while another solves a single problem that saves the company months. Research on knowledge work consistently points out how hard it is to build one universal measure for it.
For these roles, combine a few signals: goals met, quality of deliverables, and feedback from the people who rely on the work.
How to Choose the Right Productivity Metric
Use this table as a starting point.
| Role | Primary output | Useful input |
| Factory worker | Units | Labor hours |
| Support agent | Resolved tickets | Hours |
| Salesperson | Revenue/deals | Employee or hours |
| Developer | Completed outcomes | Hours/team capacity |
| Consultant | Billable value/deliverables | Hours |
| Healthcare worker | Completed services | Hours |
Ask yourself two questions. What does good work look like in this role? And can I count it fairly? If the answer to the second is no, choose a different output.
Productivity Metrics to Track Alongside Output
Output on its own is only half the picture. These metrics give it context.
Output per hour
Shows efficiency when schedules differ.
Revenue per employee
Useful for company-level trends and industry comparisons.
Task completion rate
The share of assigned tasks finished on time. It shows reliability.
Utilization rate
The share of available time spent on productive work, often billable work. It is not the same as productivity. A person can be fully utilized and still produce little of value.
Quality rate
The share of work that meets your standard on the first try.
Error and rework rate
How often work must be redone. High rework quietly eats productivity.
Customer satisfaction
Tells you whether output actually helps the people you serve.
Employee engagement
Engaged teams tend to sustain good performance. Falling engagement is often an early warning before output drops.
How to Interpret Employee Productivity Results
Getting the number is the easy part. Reading it well takes more care.
Compare against your own baseline
Your best benchmark is your own history. Start there before comparing with other companies.
Compare similar roles
Comparing a support agent with a sales rep tells you nothing. Compare like with like.
Look at trends instead of one result
One strong week may be luck. Three months of steady movement is a signal.
Account for workload differences
A team handling complex cases will have lower volume than one handling simple cases. That is not a performance problem.
Consider technology and process changes
If you introduced new software, expect the numbers to shift. Note the date so you can explain the change later.
Check quality before declaring improvement
Higher output with more errors is not progress. Look at quality and rework alongside the raw number.
Why Productivity per Employee Can Be Misleading
This metric is useful, but it has blind spots.
Headcount hides hours worked
Ten employees working 20 hours each is not the same as ten working 40. Use hours or FTE when it matters.
Revenue is affected by pricing and demand
Revenue per employee can rise because you raised prices or the market boomed, not because people worked better.
Output quality may change
A higher count can mean lower standards.
Different roles produce different types of value
A team that includes engineers, support, and finance cannot be fairly summed into one output figure.
Automation can change output without changing employee effort
If a tool handles half the work, output per employee rises even though nobody worked harder. That is a real gain, but it is not the same as effort.
Individual productivity cannot always be inferred from team-level numbers
An average of 100 orders tells you nothing about who did what.
Knowledge work is difficult to quantify
Creative and analytical work often defies simple counting.
Common Employee Productivity Calculation Mistakes
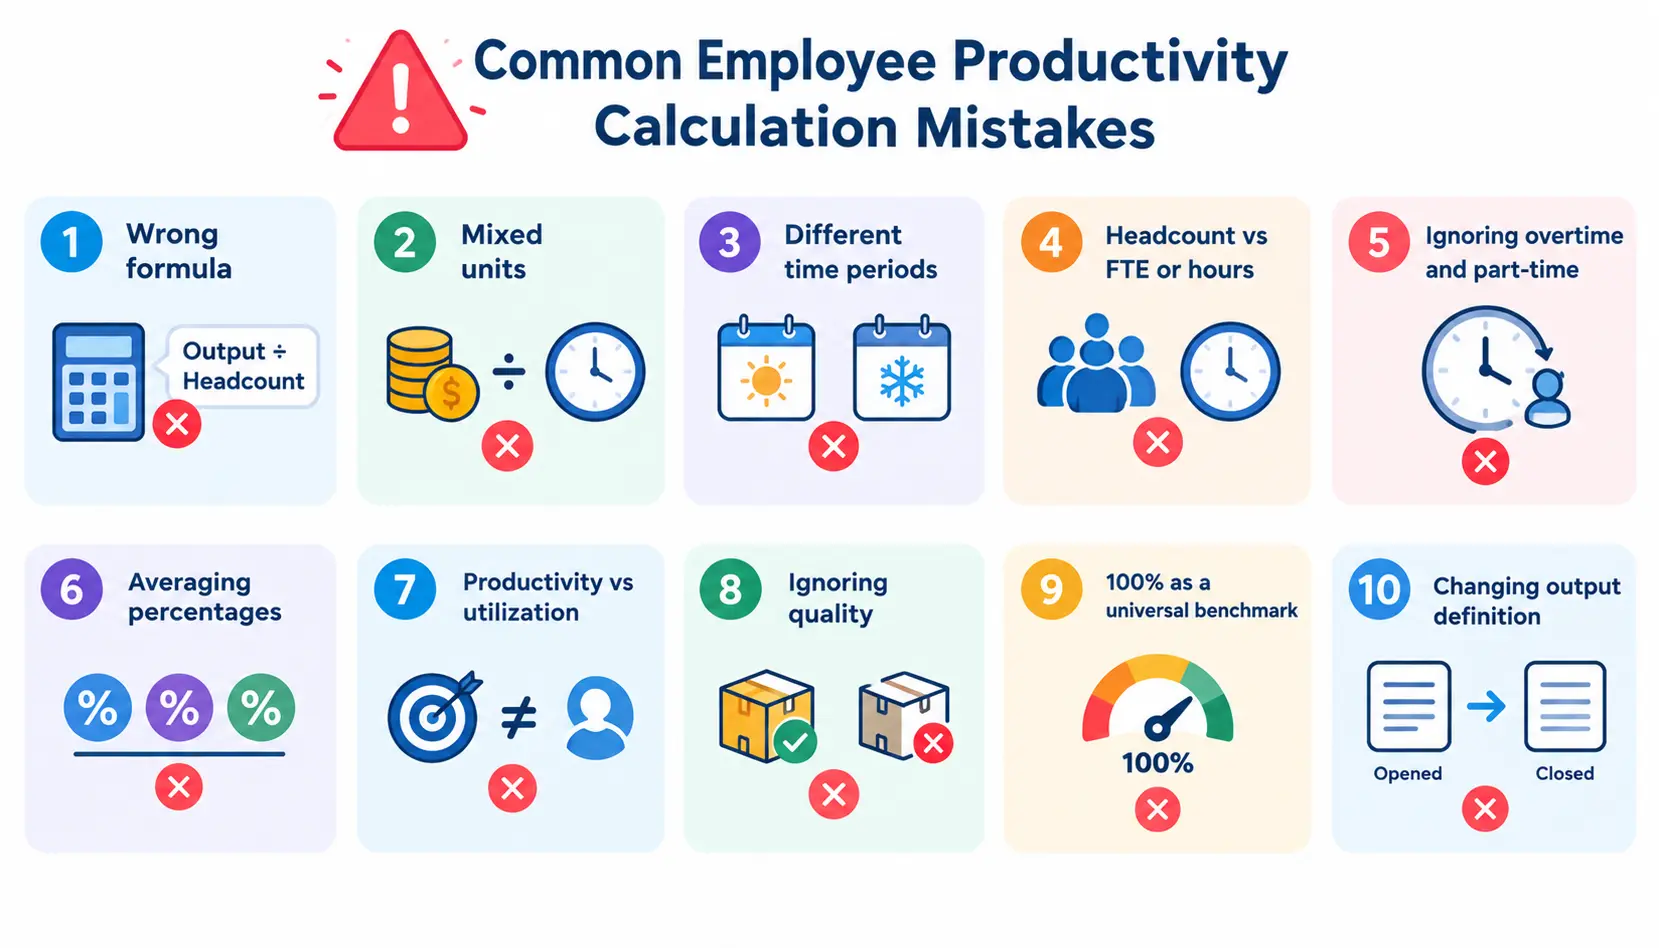
Watch for these.
Using the wrong formula
If you want efficiency per hour, do not use headcount.
Mixing different units
Do not divide dollars by hours and call it units per hour. Keep units aligned.
Comparing different time periods
A holiday week and a normal week are not comparable.
Using headcount when FTE or hours are more appropriate
Part-time and shift-based teams need hours or FTE.
Ignoring overtime and part-time work
Overtime can make output look strong while masking a staffing problem.
Averaging productivity percentages incorrectly
Use totals, as shown in the Excel section, not an average of percentages.
Confusing productivity with utilization
Utilization measures how busy people are. Productivity measures what they produce.
Ignoring quality
Fast and wrong is not productive.
Treating 100% as a universal benchmark
A 100% productivity percentage only means you hit your target. If the target was set too low, 100% may not be impressive. If it was too high, 85% might be excellent.
Changing the output definition between periods
If you counted “tickets opened” last quarter and “tickets closed” this quarter, the comparison is meaningless.
How to Improve Employee Productivity After Measuring It
Measurement is only useful if it leads to action. Start with the system before you look at the people.
Remove workflow bottlenecks
Find where work piles up. Fixing one slow approval step can lift the whole team.
Improve tools and technology
Outdated software and manual copy-paste work drain hours. Small tool upgrades often pay off fast.
Provide targeted training
Train for specific gaps you saw in the data, not for training’s sake.
Clarify goals and standards
People perform better when they know what “good” looks like.
Reduce unnecessary administrative work
Cut redundant reports and meetings that add no value.
Improve processes before simply demanding more output
Pushing harder on a broken process rarely works. Fix the process first.
Balance productivity with quality and employee wellbeing
Focusing too hard on output can contribute to burnout and turnover, a concern HR researchers regularly raise. Sustainable productivity beats short bursts that wear people out.
How Often Should You Measure Employee Productivity?
The right rhythm depends on how fast your work changes.
Daily measurement
Useful for fast-moving operations such as warehouses and support desks. Keep it light so it does not turn into micromanagement.
Weekly measurement
A good default for most teams. It smooths out daily noise while still letting you react quickly.
Monthly measurement
Best for reporting to leadership and spotting trends.
Quarterly trend analysis
Ideal for judging bigger shifts, such as the effect of a new tool or process.
If your workload swings a lot, measure more often. If it is steady, monthly is usually enough.
Tools for Calculating Employee Productivity
Excel and Google Sheets
Perfect for small teams and simple metrics. Fully flexible and free or low-cost.
Productivity calculators
Handy for quick one-off checks. Good for learning, less good for ongoing tracking.
Time-tracking software
Useful when hours are the key input, especially for billable or shift-based work.
HRIS and workforce analytics
These pull headcount, attendance, and performance data into one place, which helps larger organizations.
ERP and manufacturing systems
Capture production data automatically, which reduces manual errors on the shop floor.
Business intelligence dashboards
Combine data from many systems and show trends visually.
Rule of thumb: manual calculations are enough while you have a small team and one or two metrics. Move to automation when data collection eats more time than the analysis, or when you need to track many teams at once.
Frequently Asked Questions About Employee Productivity
1. What is the formula for employee productivity?
The basic formula is output ÷ input. For productivity per employee, the input is the number of employees. For hourly productivity, the input is hours worked.
2. How do you calculate productivity per employee?
Divide total output by the number of employees. For example, 2,000 orders ÷ 20 employees = 100 orders per employee.
3. How do you calculate productivity per hour?
Divide total output by total hours worked. If a team produces 900 units in 300 hours, productivity is 3 units per hour.
4. How do you calculate revenue per employee?
Divide total revenue by the number of employees. $1,500,000 ÷ 10 = $150,000 per employee.
5. What is a good productivity rate per employee?
There is no universal number. A good rate is one that beats your own baseline, meets your targets, and compares well with similar roles or businesses in your industry, without hurting quality.
6. How do you calculate productivity percentage?
Use actual output ÷ target output × 100. If you produced 90 units against a target of 100, productivity is 90%.
7. How do you calculate productivity growth?
Use (new productivity − old productivity) ÷ old productivity × 100. Going from 100 to 110 is 10% growth.
8. Should I use employees or hours to calculate productivity?
Use hours when schedules vary, since it is more accurate. Use employees for a quick, simple view when everyone works similar hours. FTE is a good middle ground.
9. How do you calculate employee productivity in Excel?
Enter output and hours in columns, then use =Output/Hours for hourly productivity. For a team total, use =SUM(output range)/SUM(hours range) rather than averaging individual rates.
10. How do you measure productivity for knowledge workers?
Focus on outcomes, not activity. Combine goals achieved, quality of deliverables, and feedback from colleagues or customers instead of counting tasks.
11. Can productivity be measured without monitoring employees?
Yes. Measure results such as completed work, quality, and goals met, rather than watching keystrokes or screen time. Outcome-based measures respect privacy and usually give a truer picture.
Conclusion
Productivity per employee is simple: total output divided by the number of employees. It gives you a fast, useful snapshot of how your team is performing.
But it works best as a starting point. Pair it with hourly productivity, quality checks, and a solid baseline, and read it as a trend rather than a single number. Above all, define your output clearly and keep it consistent.
Start with one role, one output, and one time period. Get that right, then build from there.

Mehreen Mushtaq is a skilled content writer dedicated to creating high-quality, engaging, and SEO-focused blogs. She specializes in strategic keyword usage, search intent, and informative content that connects with readers while helping websites strengthen their visibility and rankings in search results.