

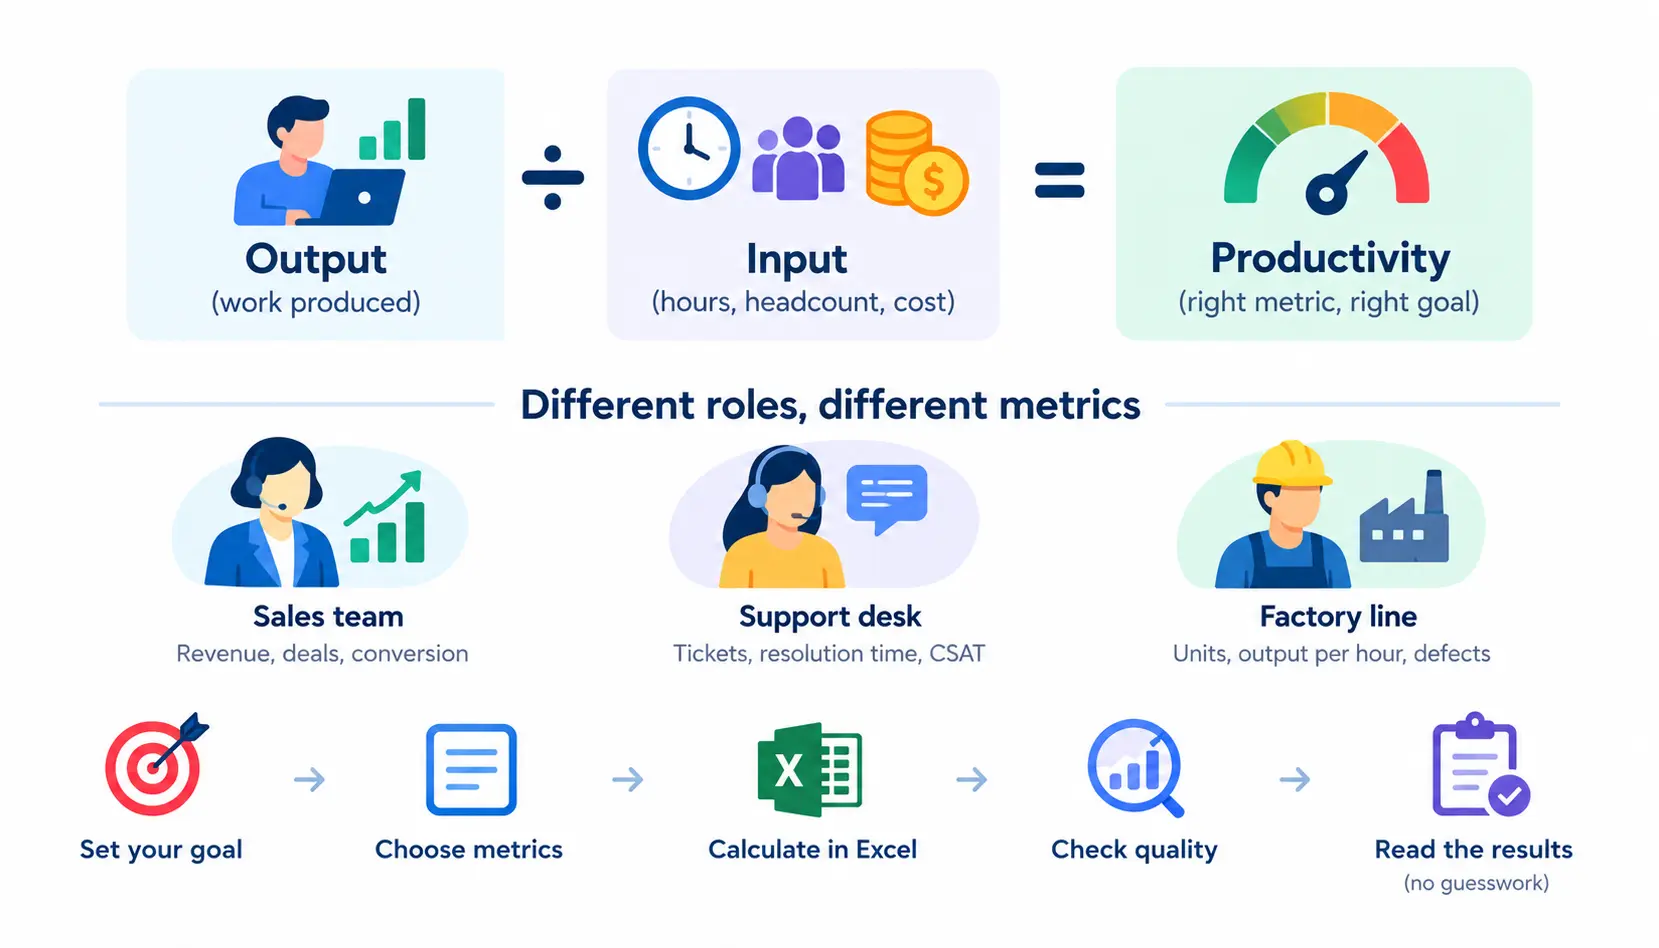
To measure employee productivity, compare the work people produce (output) with the resources they use (input), such as hours, headcount, or cost. The right metric depends on the role and the business goal. A sales team, a support desk, and a factory line each need a different yardstick.
This guide shows you how to measure employee productivity step by step, with formulas, role-based metrics, an Excel setup, and a way to read the results without fooling yourself.
What Is Employee Productivity?
Employee productivity is the amount of useful work an employee or team produces relative to the resources spent producing it. In economics, productivity is defined as a ratio of output to inputs. HR and operations teams use the same idea at the company level.
The word gets mixed up with several neighbors. Here is how they differ:
| Term | What it asks | Simple example |
| Productivity | How much output per unit of input? | 40 invoices processed per 8-hour day |
| Efficiency | How little waste went into the output? | Same 40 invoices, fewer errors and less rework |
| Utilization | How much available time was spent on work? | 6 of 8 hours were spent on billable tasks |
| Effectiveness | Did the work achieve the goal? | Invoices were paid on time and cash flow improved |
| Output | What was produced? | 40 invoices |
| Outcome | What changed because of it? | Faster payment, happier clients |
Employee productivity vs. efficiency
Productivity is about volume relative to input. Efficiency is about doing it with minimal waste. A team can be productive but inefficient if it hits its numbers only through overtime and rework.
Productivity vs. utilization
Utilization tells you how busy people are. Productivity tells you what they got done. Someone can be 100% utilized and still produce little if the work is poorly planned.
Productivity vs. effectiveness
Effectiveness asks whether you did the right thing. Productivity asks how much of it you did. You need both. Producing 500 reports nobody reads is productive and ineffective.
Output vs. outcome
Output is the thing you made. Outcome is the result it created. Whenever you can, pair the two. Tickets closed is an output, and customers whose problem was solved is an outcome.
How Do You Measure Employee Productivity?
You measure employee productivity by defining a goal, choosing a countable output and a matching input, calculating the ratio over a fixed period, and then checking it against quality measures and a baseline. Here are the eight steps.
Step 1: Define the outcome you want to measure
Start with the business goal, not the metric. Ask, “What should this role deliver for the business?” A support agent’s goal is solved customer problems. A recruiter’s is good hires made in reasonable time.
Step 2: Choose a measurable output
Pick something countable that reflects real value. Examples include units built, tickets resolved, deals closed, or reports delivered. If you can’t count it, define a clear proxy, such as milestones completed.
Step 3: Identify the input
Input is what the work consumes. Most often it’s labor hours, headcount, or labor cost. Choose the input that is easiest to track accurately.
Step 4: Select a consistent time period
Use the same window every time, such as a day, week, month, or quarter. Comparing a short week with a full month will mislead you.
Step 5: Calculate the productivity metric
Divide output by input. The next section gives you the exact formulas.
Step 6: Add quality and outcome measures
Raw output doesn’t say if the work was any good. Add an error rate, rework rate, or customer score next to it. This step is what stops people from gaming the numbers.
Step 7: Compare against a baseline
A number means little on its own. Compare it with the team’s past results, a target, or a similar team doing similar work. Your own history is usually the fairest benchmark.
Step 8: Investigate changes and take action
When a metric moves, find out why before you react. Look at workload, tools, staffing, seasonality, and process changes. Then act, and measure again.
What Is the Employee Productivity Formula?
The basic employee productivity formula is Productivity = Output ÷ Input. Every other formula is a version of this one, with the output and input made specific to your work.
Basic productivity formula
Productivity = Output ÷ Input
Use this as the general template. If a team produces 600 units using 300 labor hours, productivity is 2 units per hour.
Productivity per employee
Output ÷ Number of employees
Use this when headcount is the main input and everyone does similar work. If 10 agents resolve 1,200 tickets, that’s 120 tickets per agent. It’s less reliable when some people work part-time.
Productivity per labor hour
Output ÷ Total labor hours
This is the fairest option when schedules vary. It adjusts for overtime and part-time staff. If 8 people work a combined 320 hours and produce 960 units, productivity is 3 units per hour.
Revenue per employee
Revenue ÷ Number of employees
Use this for a high-level view of a whole company or business unit. It’s useful for tracking trends over time. It’s a poor tool for judging individuals, because revenue depends on pricing, market conditions, and team support.
Productivity percentage
(Actual output ÷ Target output) × 100
Use this when you have a clear target. If the target is 500 units and the team makes 450, productivity is 90% of target. It’s easy to communicate, but only as good as the target behind it.
Employee Productivity Metrics to Track
No single number captures productivity. Choose a small set that covers quantity, quality, and impact.
- Output per employee: Total output divided by headcount. Good for similar roles.
- Output per labor hour: Output divided by hours worked. Good for varied schedules.
- Revenue per employee: Revenue divided by headcount. Good for company-level trends.
- Task completion rate: Tasks finished divided by tasks assigned. Shows reliability.
- Goal attainment rate: Goals met divided by goals set. Shows results against plan.
- Project completion rate: Projects delivered on time and on scope. Useful for project-based teams.
- Quality and error rate: Errors, defects, or rework per unit of output.
- Customer satisfaction: CSAT or similar scores tied to the work.
- Customer retention: Customers who stay over a period. A slower, stronger signal of good work.
- Employee engagement: How committed and energized people are. Low engagement often predicts falling output later. See the overview of employee engagement.
- Absenteeism: Unplanned absence rates. A rise can signal stress or burnout.
- Time spent vs. output delivered: Compares effort with results and highlights bottlenecks.
How to Choose the Right Productivity Metrics
Start with the question you need to answer, then pick the metric that answers it.
| Business question | Metric |
| How much work is produced? | Output per employee |
| How efficiently is labor used? | Output per hour |
| What financial value is generated? | Revenue per employee |
| Are targets being achieved? | Goal attainment |
| Is work accurate? | Error or quality rate |
| Are customers benefiting? | CSAT and retention |
| Is performance sustainable? | Productivity + engagement + workload |
Keep the set small. Three to five metrics per role is usually enough. More than that and people lose sight of what matters. For a deeper breakdown of these measures, see our guide to employee productivity metrics, including formulas, examples, role-specific KPIs, and tips for choosing the right metrics.
How to Measure Productivity by Employee Role
A single KPI can’t fit every job. Here are sensible starting points for common roles.
Sales employees
- Revenue generated
- Deals closed
- Conversion rate (leads to customers)
- Customer retention
Look at these together. High revenue with high churn may mean deals are being pushed that don’t fit.
Customer support
- Tickets resolved
- Resolution time
- First-contact resolution
- CSAT
- Reopen rate
Speed alone is risky. An agent who closes tickets fast but gets many reopens is creating more work, not less.
Manufacturing and operations
- Units produced
- Output per labor hour
- Defect rate
- Downtime
Output per labor hour paired with defect rate gives a clear picture of both speed and quality.
Software developers
- Delivery milestones met
- Cycle time (from work started to work delivered)
- Defect rate
- System reliability
- Customer or business outcomes
Avoid activity metrics like lines of code or commit counts. They reward volume, not value, and are easy to game.
Marketing teams
- Qualified leads
- Campaign outcomes
- Conversion rates
- Revenue contribution
Count qualified leads, not all leads. Otherwise the number rises while sales quality falls.
Knowledge workers
Analysts, designers, lawyers, and managers create work that is hard to count. One report can take a day or a month depending on its depth. So outcome-based and qualitative measures matter more here.
Use agreed deliverables, quality reviews, peer or stakeholder feedback, and goal progress. A clear goal-setting process, such as OKRs, works better than counting tasks.
How to Measure Employee Productivity With Quality
To measure employee productivity well, always pair quantity with quality. Otherwise you may reward speed that creates problems later.
Why output alone can be misleading
Imagine two field technicians. One closes 12 work orders a day, and the other closes 9. The first looks better until you see that a third of those jobs need a return visit. Now the second technician is actually delivering more finished work.
Combine quantity and quality
Track output next to an error rate, a rework rate, or a first-time-right rate. A simple approach is to report “units completed correctly” instead of “units completed.”
Add customer outcomes
Ask whether the customer got what they needed. Satisfaction scores, complaints, and repeat purchases all show what the output turned into.
Watch for rework and errors
Rework is a hidden cost. It eats hours without adding output. A rising rework rate often points to unclear instructions, rushed targets, or missing training.
How to Measure Productivity for Remote and Hybrid Employees
Remote work doesn’t change the formula. It changes what you can see. You can’t watch people work, so you focus on results.
Focus on outcomes rather than presence
Green status dots and login hours say little about results. Judge what gets delivered and how well.
Use goals and deliverables
Agree on clear deliverables, deadlines, and quality standards. Short weekly check-ins keep expectations aligned without hovering.
Measure collaboration without counting activity
Counting messages or meetings rewards noise. Ask instead whether handoffs are smooth, questions get answered, and projects move without delays.
Avoid unnecessary surveillance
Screen recording and keystroke tracking tend to damage trust and encourage people to look busy. Use the lightest tracking that answers your question.
Use transparent measurement rules
Tell employees what you measure, why, and how the data is used. People accept measurements that are fair and explained. They resist measurement that feels hidden.
How to Measure Employee Productivity in Excel
You can build a working productivity tracker in Excel or Google Sheets in a few minutes.
Create your input and output columns
Set up one row per employee per period.
| Employee | Hours worked | Units completed | Target | Errors |
| Asha | 40 | 200 | 180 | 6 |
| Ravi | 38 | 171 | 180 | 2 |
| Meera | 32 | 176 | 150 | 4 |
Assume Employee is in column A, Hours in B, Units in C, Target in D, and Errors in E.
Calculate output per employee
Use =SUM(C2:C4)/COUNTA(A2:A4). This gives the average units per person, here (200+171+176) ÷ 3 = about 182.
Calculate output per hour
In F2, enter =C2/B2. Copy it down. Asha produces 5 units per hour, Ravi 4.5, and Meera 5.5. This levels the field for part-time schedules.
Calculate goal attainment
In G2, enter =C2/D2, and format as a percentage. Asha reaches 111%, Ravi 95%, and Meera about 117%.
Add quality metrics
In H2, enter =E2/C2 for the error rate. Asha’s is 3%, Ravi’s about 1.2%, and Meera’s about 2.3%. Now you can see that Ravi is a little below target but the most accurate.
Build a productivity dashboard
Turn the table into a chart by selecting your data and adding a column chart for output per hour and a line for error rate. Add a filter by team or month. Keep it to one screen.
How to Interpret Employee Productivity Results
Numbers only help if you read them carefully. These are common patterns and what they may mean.
What if output increases but quality decreases?
People may be rushing. Check whether targets are too aggressive or whether shortcuts are creeping in. Slow down and fix the process before pushing for more volume.
What if hours increase but output stays flat?
That signals a bottleneck, unclear priorities, or rework. Look at where time is going before adding more people or more overtime.
What if revenue increases but customer satisfaction falls?
Growth may be coming at customers’ expense, through over-promising, aggressive selling, or rushed service. Expect retention problems later.
What if task completion improves but strategic goals decline?
The team may be busy with easy tasks and avoiding the hard, important ones. Review how tasks are prioritized and how goals connect to daily work.
What if productivity rises while absenteeism also rises?
That’s a warning of possible burnout. Strong results built on overwork rarely last. Check workload, staffing, and morale.
Common Employee Productivity Measurement Mistakes
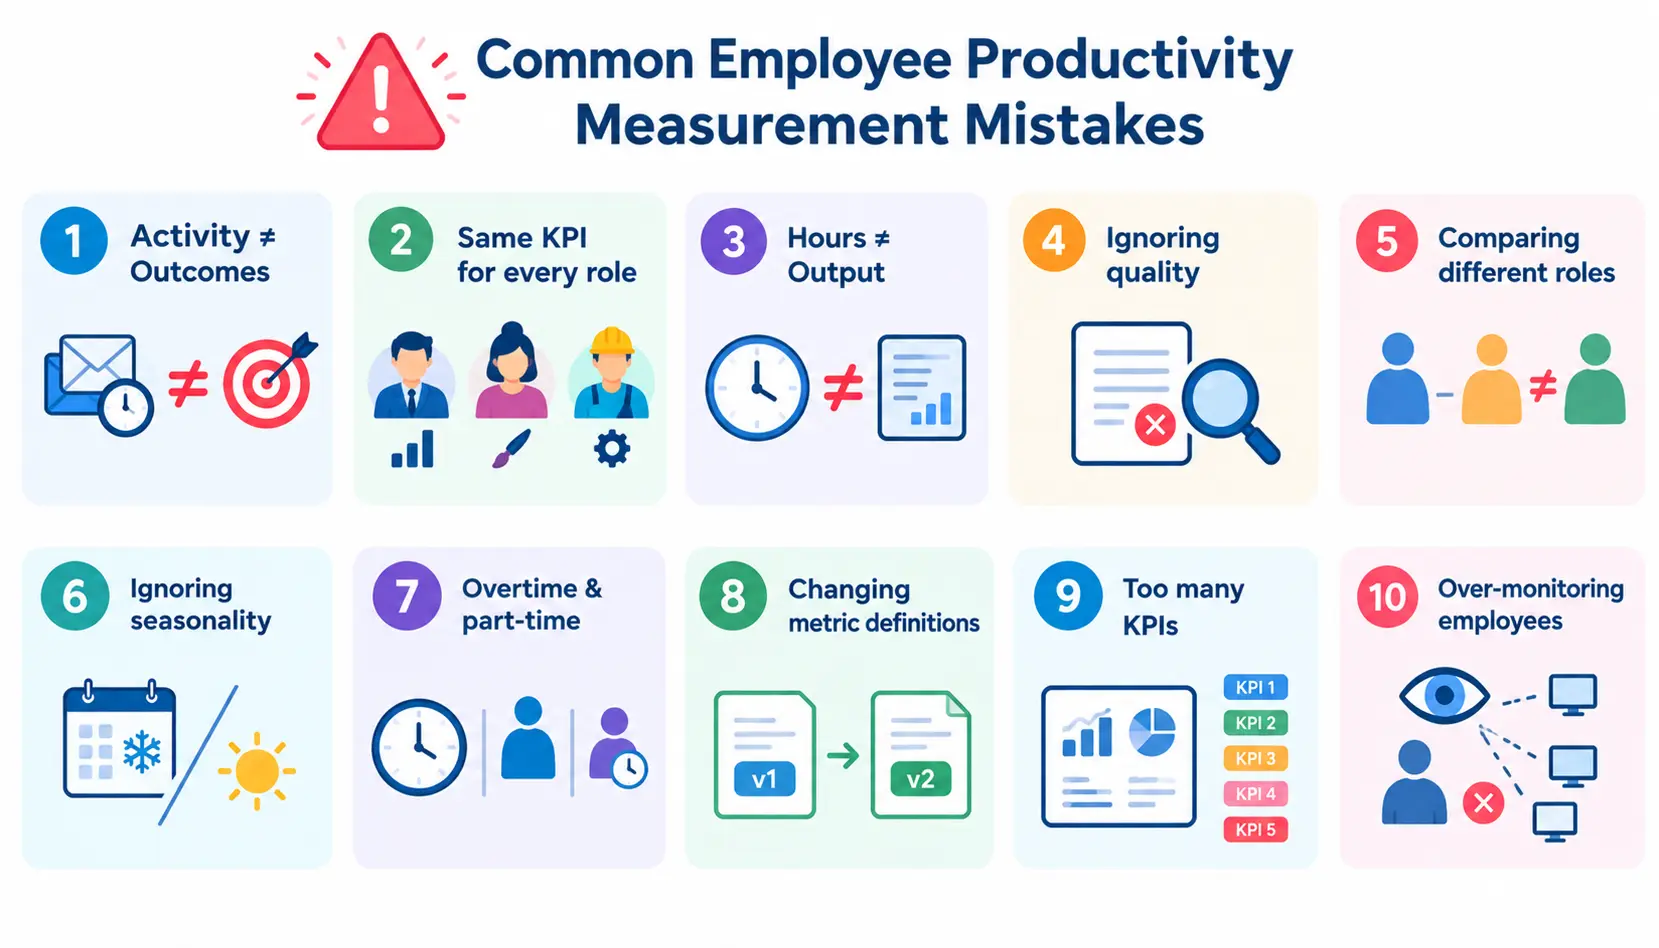
- Measuring activity instead of outcomes. Emails sent and hours logged don’t equal value delivered.
- Using the same KPI for every role. A metric that suits sales will confuse a designer.
- Measuring hours instead of output. Long hours can hide low results.
- Ignoring quality. Fast, flawed work costs more in the end.
- Comparing different roles directly. Compare like with like.
- Ignoring seasonality. Retail in December and January are not comparable months.
- Ignoring overtime and part-time work. Use per-hour measures to keep things fair.
- Changing metric definitions. If the definition shifts, trends become meaningless. Document it and keep it stable.
- Using too many KPIs. A crowded dashboard hides the signal.
- Over-monitoring employees. Micromanagement erodes trust and encourages gaming. This follows Goodhart’s law: when a measure becomes a target, it stops being a good measure.
How Often Should You Measure Employee Productivity?
Match the frequency to the pace of the work.
- Daily: Best for operational workflows such as support queues or production lines.
- Weekly: Useful for spotting short-term bottlenecks and workload swings.
- Monthly: Good for broader performance trends and team reviews.
- Quarterly: Best for strategic analysis, goal progress, and workforce planning.
Measuring too often creates noise and pressure. Measuring too rarely lets problems grow unseen. For most teams, a weekly or monthly rhythm with a quarterly review works well.
Tools for Measuring Employee Productivity
The right tool depends on what you’re measuring. Common categories include:
- Time-tracking tools: Record hours by project or task.
- HR systems: Hold headcount, attendance, and absence data.
- Project management tools: Show task and milestone progress.
- Performance management platforms: Track goals, feedback, and reviews.
- Employee surveys: Capture engagement, workload, and morale.
- Workforce analytics: Combine HR data to find patterns.
- Business intelligence dashboards: Bring data from many systems into one view.
Start with what you already use. A spreadsheet plus your project tool is enough for many teams.
How to Build an Employee Productivity Dashboard
A good dashboard answers “How are we doing, and why?” on a single screen.
- Core productivity KPIs: Output per hour or per employee.
- Quality indicators: Error rate, rework, defects.
- Outcome indicators: CSAT, retention, goal attainment.
- Trend analysis: Show at least several periods so people see direction, not a single point.
- Department and role filters: Let viewers compare like with like.
- Baseline and target comparison: Add a line for each so results have context.
Limit it to a handful of charts. If nobody acts on a chart, remove it.
How to Improve Employee Productivity After Measuring It
Measurement is only useful if it leads to change. Once you have your data:
- Identify bottlenecks. Find where work waits or piles up.
- Improve workflows. Simplify handoffs and approvals.
- Remove unnecessary work. Cut low-value reports, meetings, and steps.
- Automate repetitive tasks. Free people for judgment-heavy work.
- Improve tools and systems. Slow or clunky software quietly drains hours.
- Balance workloads. Uneven loads cause both burnout and idle time.
- Provide training. Skill gaps often show up as quality problems.
- Review targets. Make sure they’re realistic and tied to real goals.
- Act on employee feedback. The people doing the work often know the fix.
Employee Productivity Measurement Framework
Use this seven-stage loop: Define → Measure → Validate → Compare → Diagnose → Improve → Re-measure.
- Define: Set the goal and what “good” looks like for the role.
- Measure: Collect output and input data with consistent rules.
- Validate: Check the data is accurate and includes quality measures.
- Compare: Look at results against baselines, targets, and similar teams.
- Diagnose: Find the causes behind changes, using the patterns above.
- Improve: Make specific changes to processes, tools, or workload.
- Re-measure: Check whether the change worked, then repeat.
Treat it as a cycle, not a one-time project.
Frequently Asked Questions About Employee Productivity
What is the best way to measure employee productivity?
Compare output with input for a clearly defined goal, then add quality and outcome measures. The best method changes by role, so avoid a single company-wide number.
What is the formula for employee productivity?
The basic formula is Productivity = Output ÷ Input. Variations include output per employee, output per labor hour, and actual output ÷ target output × 100.
What are the most important productivity KPIs?
Output per labor hour, goal attainment, error or quality rate, and customer satisfaction cover most needs. Add engagement and absenteeism to check sustainability.
How do you calculate productivity per employee?
Divide total output by the number of employees. For example, 1,200 tickets resolved by 10 agents is 120 tickets per agent. Use hours instead of headcount when schedules differ.
How do you calculate productivity per hour?
Divide total output by total labor hours. If a team produces 960 units in 320 hours, productivity is 3 units per hour.
What is a good employee productivity rate?
There is no universal number. A good rate is one that meets your targets, beats your own baseline, and holds up on quality. Compare against your history and similar roles.
How do you measure productivity for knowledge workers?
Use agreed deliverables, goal progress, quality reviews, and stakeholder feedback rather than task counts. Outcomes matter more than volume.
How do you measure remote employee productivity?
Focus on results, not hours online. Set clear deliverables and deadlines, hold regular check-ins, and use transparent rules.
Should employee productivity be measured by hours worked?
Hours are an input, not a result. They help calculate output per hour, but hours alone say nothing about what was achieved.
How can you measure productivity without micromanaging?
Track outcomes and trends instead of individual activity. Agree on goals up front, share the metrics openly, and review results in regular conversations.
How do you measure productivity while maintaining quality?
Report quantity and quality together, such as units completed correctly or first-time-right rate. Add customer feedback and track rework.
Conclusion
To measure employee productivity well, start with the goal, pick an output and input that fit the role, and always pair quantity with quality. Use a small set of metrics, compare against a sensible baseline, and investigate before reacting to any change.
The point isn’t to watch people more closely. It’s to see where work gets stuck and fix it. Done this way, measuring employee productivity builds trust, improves results, and gives your team clearer goals.

Mehreen Mushtaq is a skilled content writer dedicated to creating high-quality, engaging, and SEO-focused blogs. She specializes in strategic keyword usage, search intent, and informative content that connects with readers while helping websites strengthen their visibility and rankings in search results.