

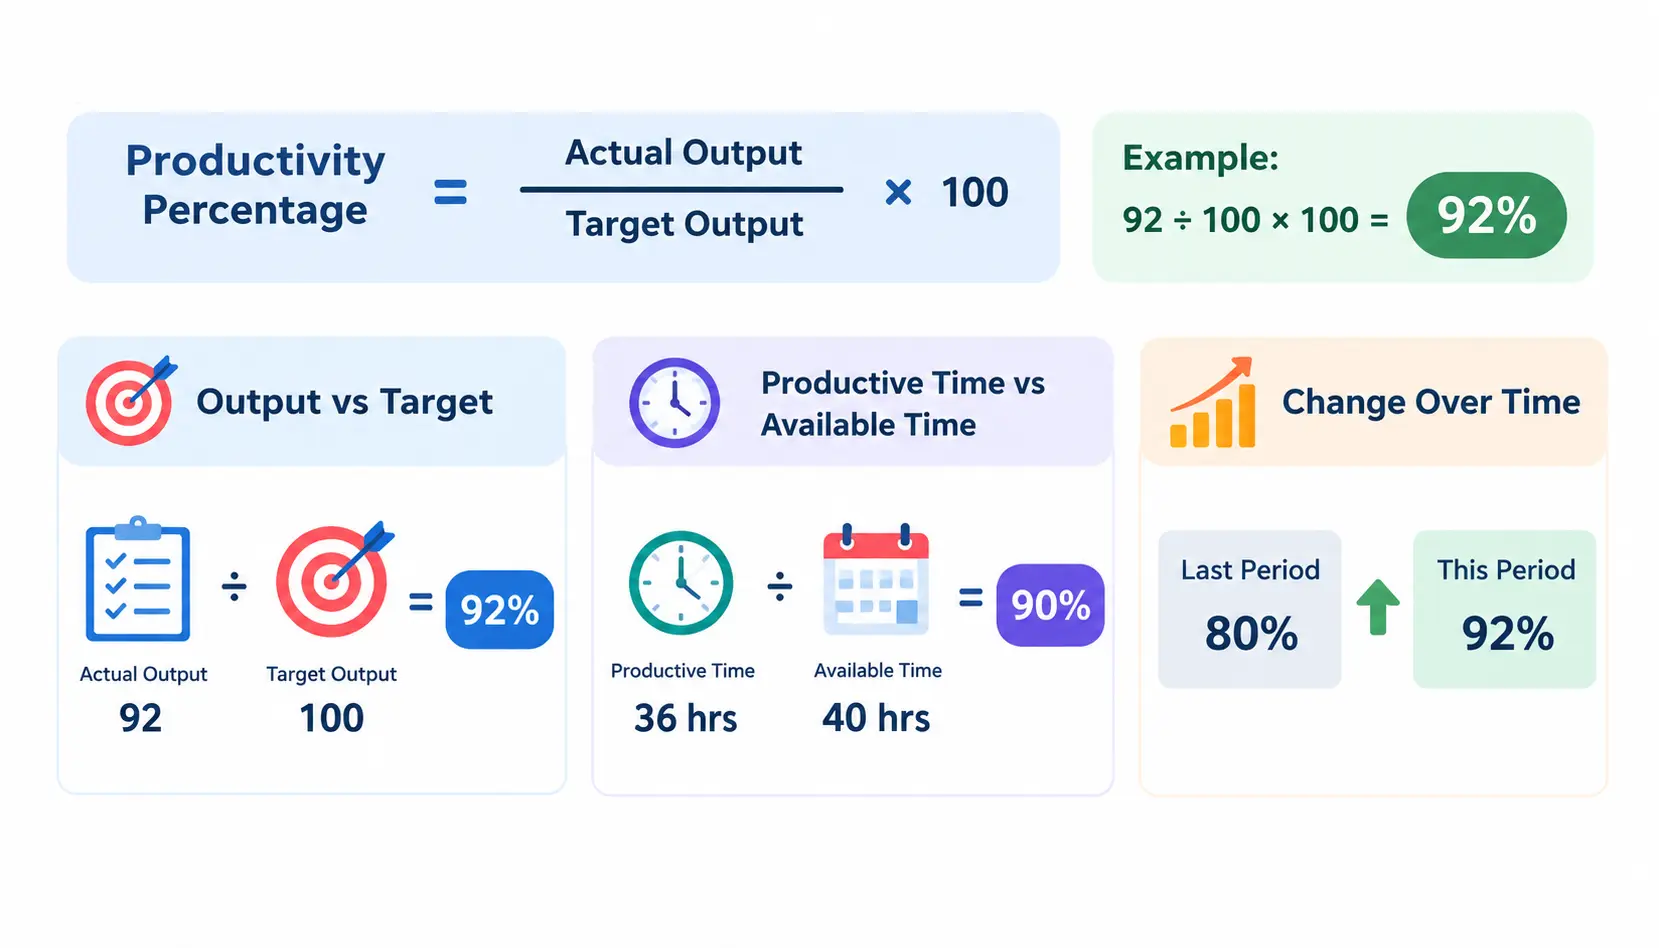
Productivity Percentage = (Actual Output ÷ Target Output) × 100
Example: If your team completed 92 tasks out of a goal of 100, that’s 92 ÷ 100 × 100 = 92%.
That’s the formula most people are searching for. But here’s the catch: “productivity percentage” isn’t always measuring the same thing. Sometimes it means output against a target. Sometimes it means productive time against available time. And sometimes it means how much productivity has changed from one period to the next. Mixing these up is one of the most common reasons productivity numbers end up misleading. This guide walks through each version, with real examples, so you calculate the right number for the right situation.
How Do You Calculate Productivity Percentage?
The basic productivity percentage formula
The most common version of this calculation compares what was actually produced against what was targeted:
Productivity % = (Actual Output ÷ Target Output) × 100
This works whether “output” means units made, tasks completed, calls answered, or sales closed. The formula stays the same, only the inputs change.
Simple example
Say a customer service rep was expected to close 100 tickets this week and closed 92. That’s:
92 ÷ 100 × 100 = 92%
Simple, clean, and easy to explain to anyone on the team.
What the result means
Below 100% means output fell short of the target. That’s not automatically bad; it depends on how realistic the target was in the first place.
Exactly 100% means output matched the target precisely. This is the baseline most teams aim for.
Above 100% means output exceeded the target. Again, context matters. This could reflect strong performance, or it could mean the target was set too low.
Can productivity be over 100%?
Yes, and it happens often. A productivity percentage above 100% simply means actual output beat the target. The important follow-up question is whether quality held up. Someone who processes 130% of their usual ticket volume but leaves customers with sloppy answers hasn’t actually become more productive, they’ve just gotten faster. Output and quality need to be read together, not as substitutes for each other.
What Does Productivity Percentage Actually Measure?
This is where a lot of confusion creeps in, because several related metrics get used interchangeably when they shouldn’t be.
Productivity percentage vs productivity rate
Productivity percentage compares output to a target or a time period, expressed as a percentage. Productivity rate is usually a raw ratio, like units produced per hour, without necessarily comparing it to a goal. A rate tells you “how much per hour.” A percentage tells you “how close to plan.”
Productivity percentage vs productivity growth
Productivity growth measures how productivity has changed over time, typically expressed as a percentage change between two periods. Productivity percentage, on the other hand, is usually a snapshot: a single period’s performance against a target. Growth is about the trend; percentage is about the moment.
Productivity percentage vs efficiency
Efficiency measures how well resources are used to produce output, think input-to-output ratio, like cost or time per unit. Productivity percentage doesn’t care about resource cost directly; it cares about whether output hit the mark. A worker can be productive (hitting targets) while being inefficient (using more resources than necessary to get there).
Productivity percentage vs utilization
Utilization measures how much of someone’s available time or capacity is actually being used, for example, billable hours against total working hours. Productivity percentage can incorporate utilization as one input, but it’s a narrower concept focused specifically on output versus target, not just “busy-ness.”
Getting these four terms straight matters more than it sounds. Discussions in professional communities often show that workplace disputes over performance reviews come down to managers and employees using the word “productivity” to mean different things. Defining your terms up front avoids that entirely.
4 Ways to Calculate Productivity as a Percentage
There isn’t one universal productivity percentage formula, there are several, and each answers a different question.
1. Productivity against a target
Actual Output ÷ Target Output × 100
Use this when you want to know: did we hit the number we set out to hit? It’s the most common version and the one most people mean by default.
2. Productive time percentage
Productive Time ÷ Available Time × 100
Use this when output is hard to count directly, but time spent on productive activity can be tracked. Common in knowledge work, where “output” is fuzzy but hours logged on focused work are not.
3. Productivity improvement percentage
(New Productivity − Old Productivity) ÷ Old Productivity × 100
Use this when you want to know how much productivity has changed over time, not whether it hit a target, but whether it’s getting better or worse.
4. Productivity index
Current Productivity ÷ Base Productivity × 100
Use this when you want an ongoing benchmark against a fixed starting point, rather than comparing to the immediately preceding period. It’s common in manufacturing and economic productivity tracking, where a base year gets set once and every later period gets measured against it.
Each of these answers a different business question, so picking the wrong one gives you a technically correct number that answers the wrong thing.
How to Calculate Productivity Percentage Step by Step
Step 1: Define the productivity measure
Decide up front which version you’re calculating: target attainment, productive time, improvement, or index. This decision shapes everything that follows.
Step 2: Define actual output
Be specific. “Tasks completed” needs a clear definition of what counts as complete. Vague definitions produce vague numbers.
Step 3: Define the target or input
Whether it’s a sales quota, a production standard, or available hours, make sure the target is documented and agreed upon, not just assumed.
Step 4: Match the measurement period
Actual output and target output need to cover the same time window. Comparing a weekly actual against a monthly target is a common and easy-to-miss mistake.
Step 5: Apply the formula
Plug the numbers into the appropriate formula from the list above.
Step 6: Check the result against quality and workload
A percentage on its own doesn’t tell the whole story. Always sanity-check it against quality metrics and whether the workload was realistic in the first place.
Productivity Percentage Examples
Example 1: Employee completing tasks
Target: 100 tasks. Actual: 92 tasks.
92 ÷ 100 × 100 = 92%
Example 2: Employee exceeding a target
Target: 100 units. Actual: 115 units.
115 ÷ 100 × 100 = 115%
Example 3: Customer support
If a support agent was expected to resolve 200 tickets this month and resolved 180, that’s 180 ÷ 200 × 100 = 90%. This kind of ticket-volume tracking is one of the most common productivity percentage use cases in support teams.
Example 4: Manufacturing
If a production line’s standard output is 1,000 units per shift and the actual output was 950 units, that’s 950 ÷ 1,000 × 100 = 95%. Manufacturing has used this kind of standard-versus-actual comparison for decades, long before it applied to office work.
Example 5: Sales
If a rep’s sales target was $50,000 and they closed $58,000, that’s 58,000 ÷ 50,000 × 100 = 116%. Sales teams often use this exact formula as the backbone of commission structures.
Example 6: Billable employee
If a consultant had 160 available hours in a month and billed 140 of them, that’s 140 ÷ 160 × 100 = 87.5% billable utilization, a specific type of productivity percentage focused on time rather than task count.
Example 7: Team productivity
If a team’s combined target was 500 completed items and they finished 470 as a group, that’s 470 ÷ 500 × 100 = 94%. Team-level percentages are useful for spotting overall trends, but they can mask wide gaps between individual performers, worth checking before drawing conclusions.
How to Calculate Productivity Improvement Percentage
Formula
(New Productivity − Old Productivity) ÷ Old Productivity × 100
Example
If a worker’s output went from 10 units per hour to 12 units per hour:
(12 − 10) ÷ 10 × 100 = 20% improvement
How this differs from target attainment
This distinction matters more than it might seem. A team can post a 20% improvement in output while still sitting well below 100% of its target, improvement and target attainment are two different measurements answering two different questions. One tells you the direction of travel; the other tells you the distance still to cover.
Government labor statistics agencies, including the U.S. Bureau of Labor Statistics, track productivity change over time using this exact logic, comparing output per hour worked between periods to measure whether productivity is rising or falling across an industry or the economy as a whole. You can find their published methodology on bls.gov if you want to go deeper into how this is applied at a national scale. Wikipedia’s overview of labor productivity is also a useful starting point for the underlying economic concept.
How to Calculate Productivity Percentage Using Hours
Productive time vs available time
Productive time is the portion of a person’s schedule actually spent on value-generating work. Available time is the total time they were scheduled or present to work. The ratio between them is one of the simplest productivity percentages to track, especially in roles where output is hard to count directly.
Scheduled hours vs actual hours worked
Scheduled hours are what’s planned on paper. Actual hours worked can differ due to overtime, early departures, or unplanned absences. Using the wrong one as your denominator will quietly skew your percentage.
Paid hours vs hours actually worked
These aren’t the same thing, and mixing them up is a common source of error. Paid hours can include holiday pay, sick leave, or other time off, while hours actually worked reflects only time spent on the job. Labor statistics researchers have noted that using hours actually worked, rather than hours paid, tends to give a more precise picture of labor input, since it strips out time that couldn’t have contributed to output in the first place.
Example with an 8-hour workday
Say someone works an 8-hour shift. Out of that, 45 minutes goes to breaks, 1 hour goes to meetings, and 30 minutes goes to admin tasks like email and reporting. That leaves 5 hours and 45 minutes of directly productive time.
5.75 ÷ 8 × 100 = 71.9% productive time
This is a normal number, not a red flag, most jobs realistically include non-productive but necessary time. The mistake is expecting productive time percentage to reach 100%, which it almost never does in practice.
How to Calculate Labor Productivity
Labor productivity formula
Output ÷ Labor Hours
This is slightly different from the percentage-based formulas above, it’s usually expressed as a rate (units per hour) rather than a percentage, though it can be converted into an index or percentage change over time. For a broader look at output, input, labor hours, productivity per employee, and other related calculations, see our guide to the employee productivity formula.
Example
If a factory produces 2,400 units using 300 labor hours:
2,400 ÷ 300 = 8 units per labor hour
Output per employee vs output per hour
Output per employee is simpler to calculate but can be misleading if employees work different numbers of hours. Output per hour normalizes for that difference, which is why it’s the preferred measure in most formal productivity analysis.
Why hours worked can be more useful than headcount
Two teams with the same headcount can have very different actual working hours due to part-time staff, overtime, or absences. Measuring productivity against hours worked, rather than simple headcount, gives a fairer and more accurate comparison. This is the same approach labor economists use when comparing productivity across industries or countries.
Productivity Percentage Formula Cheat Sheet
| Metric | Formula | Purpose |
| Target attainment | Actual ÷ Target × 100 | Measure progress against target |
| Productive time | Productive Time ÷ Available Time × 100 | Measure productive time |
| Labor productivity | Output ÷ Labor Hours | Measure output per hour |
| Productivity improvement | (New − Old) ÷ Old × 100 | Measure change |
| Productivity index | Current ÷ Base × 100 | Compare with baseline |
How to Calculate Productivity Percentage in Excel
You don’t need complicated formulas to track this in a spreadsheet. A few basic ones cover almost every scenario.
Actual vs target
=Actual/Target*100
Productivity improvement
=(New-Old)/Old*100
Productive time percentage
=ProductiveHours/AvailableHours*100
Build a simple productivity tracker
A basic tracker doesn’t need to be complicated. Set up columns for:
- Employee
- Period
- Actual output
- Target
- Productivity %
- Quality score
- Notes
Keeping “quality score” and “notes” right next to the percentage forces anyone reviewing the sheet to look at context, not just the raw number. This small habit prevents a lot of the misinterpretation that raw productivity percentages tend to invite.
How to Interpret Productivity Percentages
What does below 100% mean?
It means actual output didn’t reach the target for that period. It’s worth investigating why, but it isn’t automatically a performance problem. Targets set without realistic input from the people doing the work are a common cause.
What does 100% mean?
It means output matched the target exactly. This is often treated as the “on track” benchmark, but it shouldn’t be treated as a ceiling.
What does above 100% mean?
It means output beat the target. Worth celebrating, but also worth checking, if it happens consistently across a whole team, the target itself may be too easy.
Why a higher percentage isn’t always better
Chasing a higher number can quietly encourage cutting corners. A rep who “productively” pushes through calls without actually solving customer problems is optimizing for the wrong thing. The percentage went up; the actual value delivered didn’t.
Why quality must be considered
Output volume and output quality are two separate dimensions, and a productivity percentage on its own only captures the first one. A useful way to think about it: two employees can both hit 100% of a task-completion target, but if one employee’s work has a much higher error or rework rate, their real productivity is lower, even though the percentage looks identical. This is exactly why experienced operations teams pair a productivity percentage with a quality metric before drawing conclusions, rather than reading the percentage alone.
What Is a Good Productivity Percentage?
Why there is no universal percentage
There’s no single number that counts as “good” across every job, industry, and team. A target attainment rate that’s excellent for a call center might be mediocre for a sales team, and vice versa. Anyone giving you a flat “90% is good” answer without context is oversimplifying.
Compare against historical performance
The most useful benchmark is usually the person’s or team’s own past performance. A steady 85% that’s trending upward often matters more than a one-time 110%.
Compare against role-specific targets
Different roles carry different realistic ranges. A manufacturing line with tight tolerances will have a different “normal” range than a creative role where output is harder to standardize.
Compare against industry benchmarks
Where available, industry data from trade associations, government labor statistics, or professional networks like LinkedIn’s business community can offer a useful reality check on what’s typical for your field.
Consider workload and complexity
A 90% attainment rate on a heavier, more complex workload can represent stronger performance than 100% on an easy one. Raw percentages don’t capture difficulty.
Keep quality thresholds in place
Whatever percentage you settle on as “good,” pair it with a minimum quality standard. A percentage without a quality floor invites the kind of corner-cutting mentioned earlier.
Common Productivity Percentage Calculation Mistakes
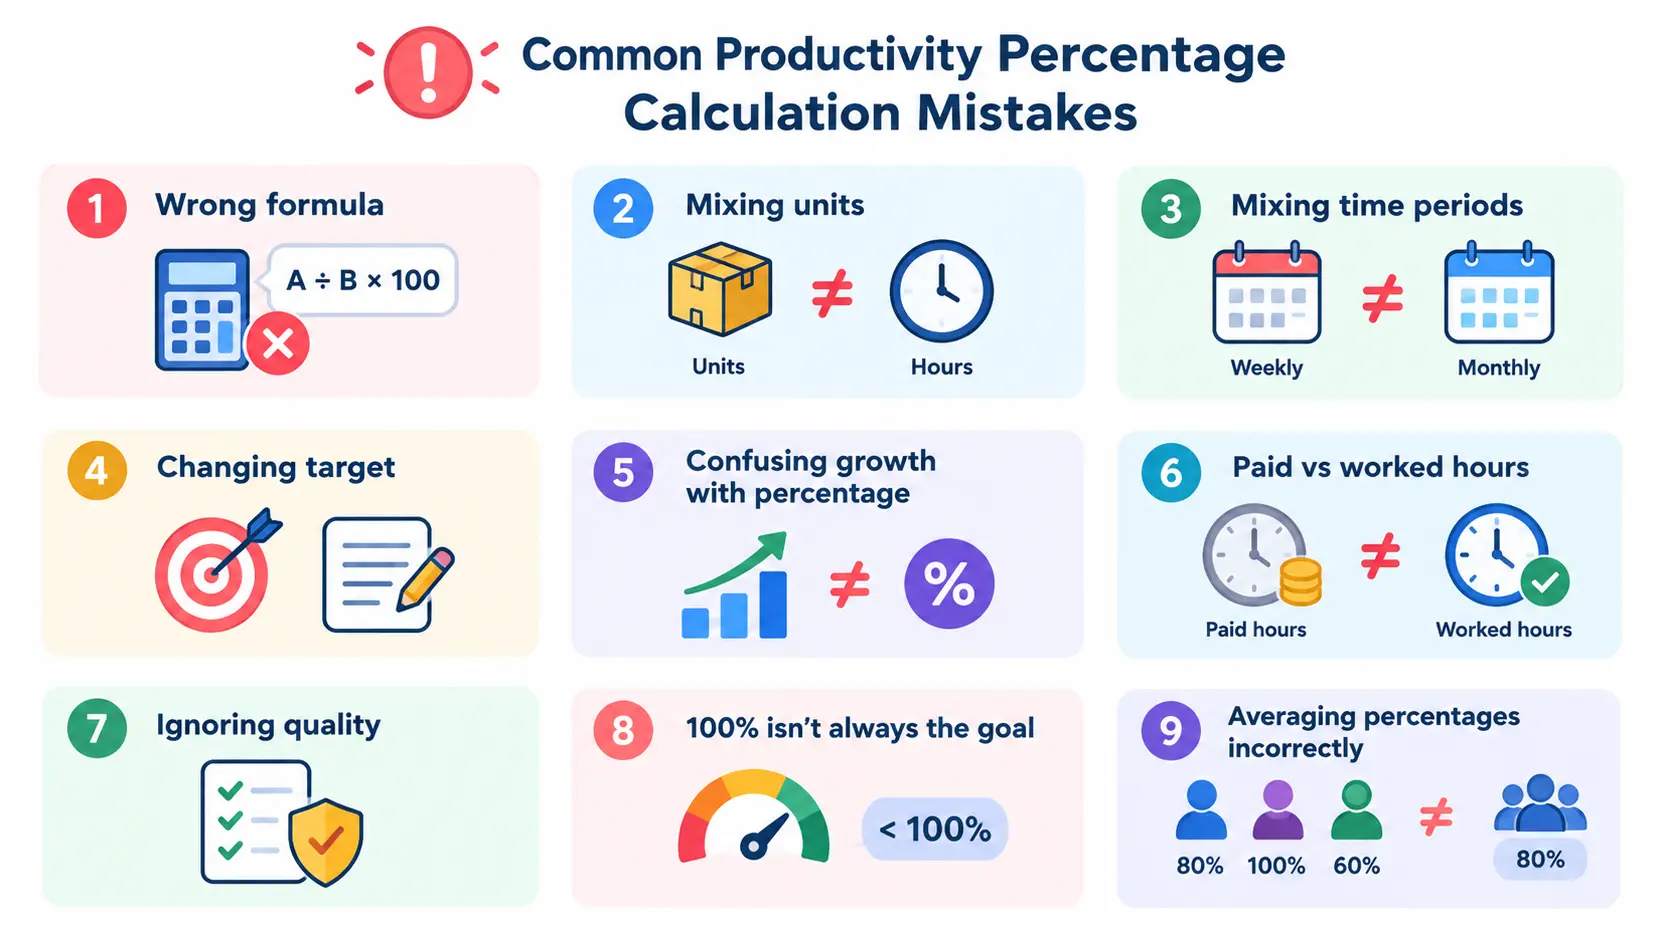
- Using the wrong formula: applying target attainment logic when you actually need an improvement or index calculation.
- Mixing different units: comparing units produced to hours worked without converting them to a common basis.
- Mixing different time periods: comparing a weekly actual to a monthly target, or vice versa.
- Changing the target without documenting it: makes historical comparisons meaningless.
- Confusing productivity percentage with productivity growth: a snapshot metric and a change-over-time metric answer different questions.
- Using hours paid instead of hours worked without explaining the difference: inflates or deflates the denominator inconsistently.
- Ignoring quality: treating the percentage as the whole story when it’s only part of it.
- Treating 100% as a universal benchmark: some roles realistically run below 100% due to unavoidable non-productive time.
- Averaging individual percentages incorrectly: a simple average of percentages across employees with different workloads can distort the real team-level figure. It’s usually more accurate to sum actual output and target output separately, then calculate the percentage once at the aggregate level.
How to Improve Productivity After Measuring It
Measuring the number is only useful if it leads to action. A few practical next steps:
Find bottlenecks. Look for the specific step in a process where work piles up or slows down.
Improve processes. Simplify handoffs, remove unnecessary approval steps, and cut duplicate work.
Automate repetitive tasks. Anything rule-based and repetitive is a candidate for automation, freeing up time for higher-value work.
Provide targeted training. A skills gap in one specific area often explains a low percentage better than a general “try harder” conversation.
Set clearer targets. Vague or unrealistic targets produce unreliable percentages no matter how well the work is actually going.
Improve tools. Outdated software or clunky systems quietly eat into productive time.
Reduce unnecessary interruptions. Meetings and notifications are a common, underrated drag on productive time percentage specifically.
Recalculate after making changes. Don’t assume an improvement worked, remeasure using the same formula and compare.
Productivity Percentage vs Other Productivity Metrics
| Metric | Measures |
| Productivity percentage | Progress against a target or time/resource ratio |
| Productivity rate | Output per unit of input |
| Labor productivity | Output per labor-hour |
| Efficiency | Resource use relative to output |
| Utilization | Use of available capacity/time |
| Productivity growth | Change in productivity over time |
If you want to compare these measures in more detail, see our guide to employee productivity metrics, including formulas, examples, and practical KPIs.
Frequently Asked Questions
1. How do you calculate productivity percentage?
Divide actual output by target output, then multiply by 100. The exact inputs depend on whether you’re measuring target attainment, productive time, or improvement over time.
2. What is the productivity percentage formula?
The most common version is Actual Output ÷ Target Output × 100, though productive time and productivity index calculations use slightly different formulas for different purposes.
3. What is an example of productivity percentage?
If someone completes 92 out of a target of 100 tasks, their productivity percentage is 92%.
4. Can productivity be more than 100%?
Yes. It simply means actual output exceeded the target. It’s worth checking quality alongside any result well above 100%.
5. What is a good productivity percentage?
There’s no universal answer, it depends on the role, industry, and workload. Comparing historical performance and role-specific targets is more reliable than chasing a fixed number.
6. How do you calculate employee productivity percentage?
Compare an individual’s actual output, tasks, units, sales, or tickets, against their assigned target, using the same basic formula: Actual ÷ Target × 100.
7. How do you calculate productivity percentage in Excel?
Use a simple formula like =Actual/Target*100 in a cell, referencing the columns for actual and target output.
8. How do you calculate productivity improvement percentage?
Subtract old productivity from new productivity, divide by old productivity, then multiply by 100: (New − Old) ÷ Old × 100.
9. How do you calculate labor productivity?
Divide total output by total labor hours: Output ÷ Labor Hours. This is usually expressed as a rate, like units per hour, rather than a percentage.
10. What is the difference between productivity percentage and productivity rate?
Productivity percentage compares output to a target or baseline as a percentage. Productivity rate is typically a raw ratio, like output per hour, without a built-in comparison point.
11. Is productivity percentage the same as efficiency?
No. Productivity percentage focuses on whether output hit a target. Efficiency focuses on how well resources were used to get there. A team can be productive but inefficient, or efficient but not fully productive.
12. How do you calculate productivity based on hours worked?
Divide output by hours actually worked, rather than hours paid or hours scheduled, for the most accurate picture of labor input.
Conclusion
Calculating productivity percentage isn’t complicated once you know which version you actually need. Most of the time, the answer is simple: divide actual output by target output and multiply by 100. But as this guide has shown, “productivity percentage” can also mean productive time against available time, productivity change between periods, or performance against a baseline index, and picking the wrong one gives you a number that’s technically correct but answers the wrong question.
The bigger takeaway is this: a productivity percentage is only as useful as the context around it. Match your time periods, use consistent units, and always read the number alongside quality and workload, not on its own. Do that, and productivity percentage becomes a genuinely useful tool for spotting trends, setting fair targets, and having better conversations about performance, instead of just another number that gets misread.

Mehreen Mushtaq is a skilled content writer dedicated to creating high-quality, engaging, and SEO-focused blogs. She specializes in strategic keyword usage, search intent, and informative content that connects with readers while helping websites strengthen their visibility and rankings in search results.