

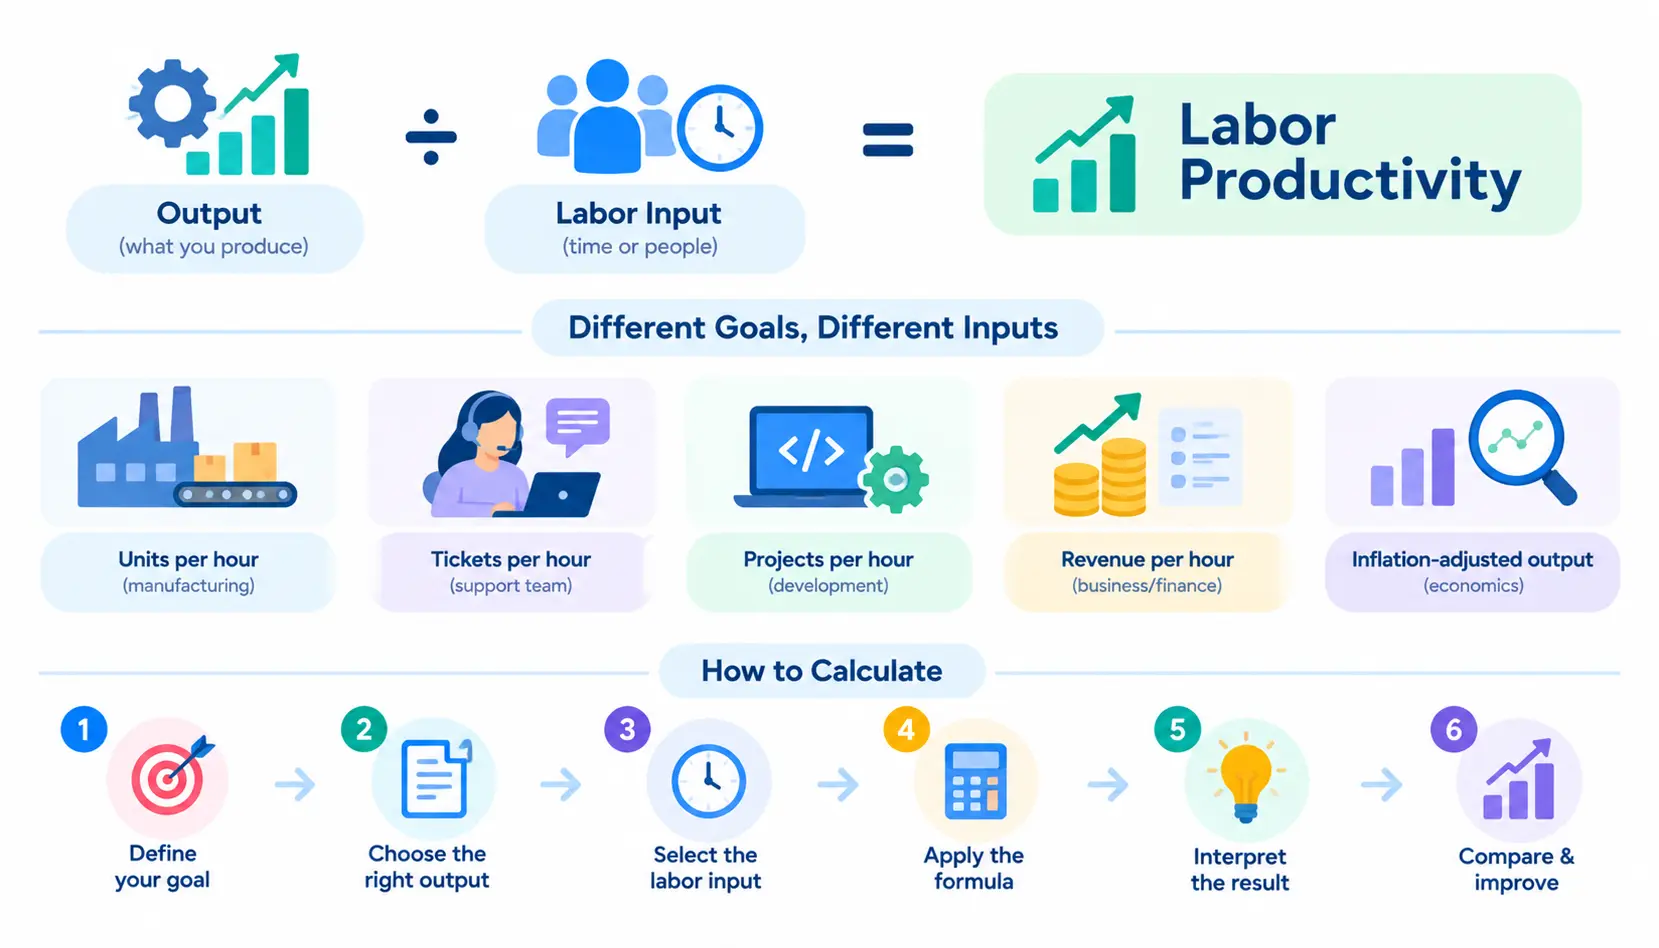
Labor productivity measures how much output your workforce produces for each unit of labor input, usually each hour worked. The core formula is simple: Labor Productivity = Output ÷ Labor Input.
The tricky part is choosing the right output and the right labor input. A factory might count units per hour. A support team might count tickets resolved per hour. An economist might use inflation-adjusted output per hour worked. The formula stays the same, but the inputs change with your goal.
This guide shows you how to calculate labor productivity step by step, with worked examples, common mistakes, and ways to interpret your results.
What Is Labor Productivity?
Simple definition
Labor productivity is the amount of goods or services produced per unit of labor. If a team produces more in the same number of hours, its labor productivity goes up.
What labor productivity measures
It tells you how effectively labor turns into output. It does not tell you how hard people work. A team can work very hard and still have low productivity if the process, tools, or materials hold them back.
Labor productivity vs. productivity vs. efficiency
“Productivity” is the broad idea of output relative to inputs. Labor productivity narrows that to labor only. Efficiency is a related but different idea: it usually asks how little waste you create while producing something, such as time, materials, or energy.
In practice, people often use these words loosely. When you report a number, state exactly what you measured.
Labor productivity vs. multifactor productivity
The U.S. Bureau of Labor Statistics (BLS) treats labor productivity as output relative to hours worked. Multifactor productivity (MFP) is broader. It compares output to a combination of inputs, such as labor, capital, energy, materials, and services. You can read more on the BLS productivity page and in this Wikipedia overview of labor productivity.
What Is the Labor Productivity Formula?
Basic labor productivity formula
Labor Productivity = Output ÷ Labor Input
“Labor input” can be hours, workers, or labor cost. Each choice answers a slightly different question.
Output per labor hour
Output per hour = Total output ÷ Total labor hours
This is the most common version. It is also the closest match to how BLS defines labor productivity.
Output per worker
Output per worker = Total output ÷ Number of workers
This is quick to calculate, but it treats a part-time employee and a full-time employee as equal.
Output per labor cost
Output per labor cost = Output ÷ Labor cost
This shows how much output you get for each dollar spent on labor.
Which formula should you use?
| Formula | Best used when | Watch out for |
| Output ÷ labor hours | Schedules vary, or you want precision | You need reliable time records |
| Output ÷ workers | You need a fast, rough view | Hides part-time and overtime differences |
| Output ÷ labor cost | You care about cost-effectiveness | Wage differences can distort the result |
How to Calculate Labor Productivity Step by Step
Step 1: Choose the measurement period
Pick a consistent period, such as a week, month, or quarter. Very short periods can be noisy. A single slow Monday tells you little.
Step 2: Define the output
Decide what “output” means for your work: units produced, tickets resolved, square feet installed, or sales value. Write the definition down so you use it the same way next time.
Step 3: Calculate labor input
Add up the hours actually worked by everyone who contributed to the output. If you use headcount or labor cost instead, be consistent.
Step 4: Apply the formula
Divide output by labor input. For example, 1,200 units ÷ 100 hours = 12 units per hour.
Step 5: Interpret the result
A number on its own means little. Ask what it means compared with your last period, your target, or a similar team.
Step 6: Compare against another period
Calculate the same measure for the previous period and look at the change. This is where the real insight sits, and we cover it in the growth section below.
How to Measure Labor Hours Correctly
Getting hours right matters more than most people expect. A small error here can swing the whole result.
Hours worked vs. paid hours
BLS distinguishes between hours worked and hours paid. Paid hours include time such as vacation and sick leave, when no output is being produced. Hours worked count only time on the job. For productivity, hours worked usually gives a truer picture.
Full-time and part-time employees
Two part-timers working 20 hours each are not the same as one full-time worker at 40 hours in headcount terms, but they are in hours terms. That is why hours are usually a better base than headcount.
Overtime
Count overtime hours as real hours worked. Leaving them out inflates your productivity number, because you are counting the output but not all of the effort behind it.
Vacation, leave, and non-working hours
Exclude paid time off when you measure productivity per hour worked. If you include it, you are diluting your result with hours that produce nothing.
FTE vs. actual hours
Full-time equivalent (FTE) is a handy way to compare staffing levels. But it is an estimate. When you have timesheets, actual hours are more accurate.
How to Define Output for Labor Productivity
Physical units
Units, tons, tickets, or completed jobs work well when you produce one uniform thing. They are simple and easy to explain.
Revenue
Revenue is easy to find, but it moves with prices, discounts, and demand. A price increase can make productivity look better when nothing changes on the floor.
Real output
Real output is output adjusted for price changes. It strips out the effect of inflation, so you are comparing actual volume rather than dollar amounts.
Value-added output
Value added is what a business creates after subtracting the cost of bought-in materials and services. It is useful when you want to measure the contribution of your own work, not the value of the inputs you purchased.
Service output
Services are harder to count. Common proxies include cases closed, appointments completed, or projects delivered. Pick a proxy that reflects real work, and watch for quality trade-offs.
What to do when a company produces multiple products
Adding different units together, such as chairs plus tables plus shelves, does not make sense. Formal economic measures usually convert output into money terms and adjust for price changes. For internal use, you can track each product line separately or weight them by standard hours or standard value.
Labor Productivity Calculation Examples
Manufacturing example
- Inputs: 12,000 units produced; 800 labor hours
- Formula: Units ÷ labor hours
- Calculation: 12,000 ÷ 800
- Result: 15 units per labor hour
- Interpretation: Each hour of work produced 15 units. Compare this against last month before deciding if it is good.
Construction example
- Inputs: 4,800 square feet of drywall installed; 320 labor hours
- Formula: Completed work ÷ labor hours
- Calculation: 4,800 ÷ 320
- Result: 15 square feet per labor hour
- Interpretation: Useful for estimating future jobs, as long as the conditions are similar.
Customer service example
- Inputs: 1,800 tickets resolved; 300 labor hours
- Formula: Tickets resolved ÷ labor hours
- Calculation: 1,800 ÷ 300
- Result: 6 tickets per labor hour
- Interpretation: Check quality too. Six tickets an hour is not a win if half come back reopened.
Professional services example
- Inputs: $96,000 in billed work; 640 labor hours
- Formula: Billable output ÷ labor hours
- Calculation: $96,000 ÷ 640
- Result: $150 of billed output per labor hour
- Interpretation: This mixes volume with pricing. If rates changed, the number will move even if the work did not.
Company-wide example
- Inputs: $2,400,000 in real output (adjusted to base-year prices); 24,000 total labor hours
- Formula: Real output ÷ total labor hours
- Calculation: 2,400,000 ÷ 24,000
- Result: $100 of real output per labor hour
- Interpretation: Best tracked over several years to see the trend.
Output-per-worker example
- Inputs: 12,000 units; 20 workers
- Formula: Output ÷ number of employees
- Calculation: 12,000 ÷ 20
- Result: 600 units per worker
- Interpretation: Fine as a quick check, but it hides differences in hours worked.
How to Calculate Labor Productivity Growth
BLS reports productivity changes over time, often as percentage changes and index numbers. You can do the same on a small scale.
Productivity growth formula
Productivity growth (%) = (Current productivity − Previous productivity) ÷ Previous productivity × 100
Example comparing two periods
Last quarter: 15 units per hour. This quarter: 16.5 units per hour.
(16.5 − 15) ÷ 15 × 100 = 10% growth
How to interpret an increase
An increase means you produce more per hour. Look for the cause. It could be better tools, training, or workflow. It could also be a temporary spike from an easy product mix.
How to interpret a decrease
A drop is a prompt to investigate, not a verdict. Common causes include new hires still learning, equipment downtime, supply delays, or more complex work. If output falls from 16.5 to 15 units per hour, that is a 9.1% decline (1.5 ÷ 16.5).
Output per Hour vs. Output per Worker
| Measure | Formula | Advantage | Limitation |
| Output per hour | Output ÷ hours | Accounts for actual work time | Requires reliable hours data |
| Output per worker | Output ÷ workers | Easy to calculate | Can hide part-time differences |
| Output per labor cost | Output ÷ labor cost | Connects productivity to cost | Affected by wage differences |
Hours are usually more precise when your team has different schedules. Imagine two teams with 10 workers each. One works 40-hour weeks. The other works 25-hour weeks. Output per worker would make the second team look far less productive, even if their output per hour is identical.
Real Output vs. Revenue in Labor Productivity
Why revenue can be misleading
Revenue rises when you raise prices. That does not mean your team got faster. Revenue also falls during a discount campaign, even if your team did more work.
Nominal vs. real output
Nominal output is measured at current prices. Real output adjusts for price changes so you can compare across time fairly.
When physical units are better
If you make one product or a few similar ones, units are cleaner and easier to explain to your team.
When value-added output is appropriate
Use value added when you want to isolate what your own operation contributes, especially if material costs swing widely.
Why formal economic measures adjust for price changes
Economists want to know whether the economy is producing more, not just charging more. That is why official productivity statistics work with real, inflation-adjusted output.
How to Calculate Labor Productivity by Industry
Manufacturing
Units per labor hour is the standard. Track production volume, and account for scrap and rework. Producing 1,000 units with 100 defective ones is not the same as 1,000 good ones.
Construction
Use completed work per labor hour, such as square feet, linear feet, or fixtures installed. Construction is harder to standardize than a factory line. Tasks are less repetitive, and crew makeup, project complexity, weather, and site conditions all shift the result. Compare like with like, and track it by crew and task type.
Retail
Track sales per labor hour and transactions per labor hour. Sales per hour is affected by foot traffic and pricing, so watch both.
Customer service
Use cases or tickets per labor hour, and pair it with a quality measure such as first-contact resolution or customer satisfaction.
Professional services
Use billable output per hour or value delivered per hour. Be careful with pure billing numbers, since they depend on rates as well as effort.
What Factors Affect Labor Productivity?
Technology and automation
Better software and machinery can multiply what each hour produces.
Equipment and capital
Reliable, well-maintained equipment reduces downtime. Workers with better tools generally produce more per hour.
Employee skills
Experienced, skilled workers usually work faster and make fewer errors.
Training
Good training shortens the learning curve and cuts rework. Motivation matters too, though it is harder to measure.
Production processes
How work is sequenced and organized often matters as much as how fast people move.
Management and organization
Clear priorities, sensible scheduling, and good communication remove hidden waste.
Supplier reliability
Late or poor-quality materials stall production. Your team’s productivity can suffer from problems it did not cause.
Labor Productivity vs. Multifactor Productivity
What labor productivity measures
Output relative to labor input only.
What multifactor productivity measures
Output relative to combined inputs, including labor, capital, energy, materials, and services. See the Wikipedia page on total factor productivity for the broader concept.
When to use each
Use labor productivity for day-to-day operations and workforce planning. Use multifactor productivity when you want to know whether the whole production system got more efficient, not just labor.
Example of labor vs. multifactor productivity
A company buys a costly new machine. Output per labor hour jumps, so labor productivity looks great. But the machine’s cost is significant. A multifactor view would show whether the gain was worth the added capital.
How to Interpret a Labor Productivity Result
What a higher ratio means
More output per unit of labor. That is generally good, provided quality holds.
What a lower ratio means
Less output per unit of labor. Check for causes before drawing conclusions.
Why productivity should be compared over time
The trend tells you more than a single figure. Track it monthly or quarterly.
Why industry benchmarks need context
A benchmark from another company may use different definitions of output and hours. Make sure you compare like with like.
Why one productivity number does not explain performance
Productivity is one lens. It does not capture quality, safety, customer satisfaction, or morale.
Common Labor Productivity Measurement Mistakes
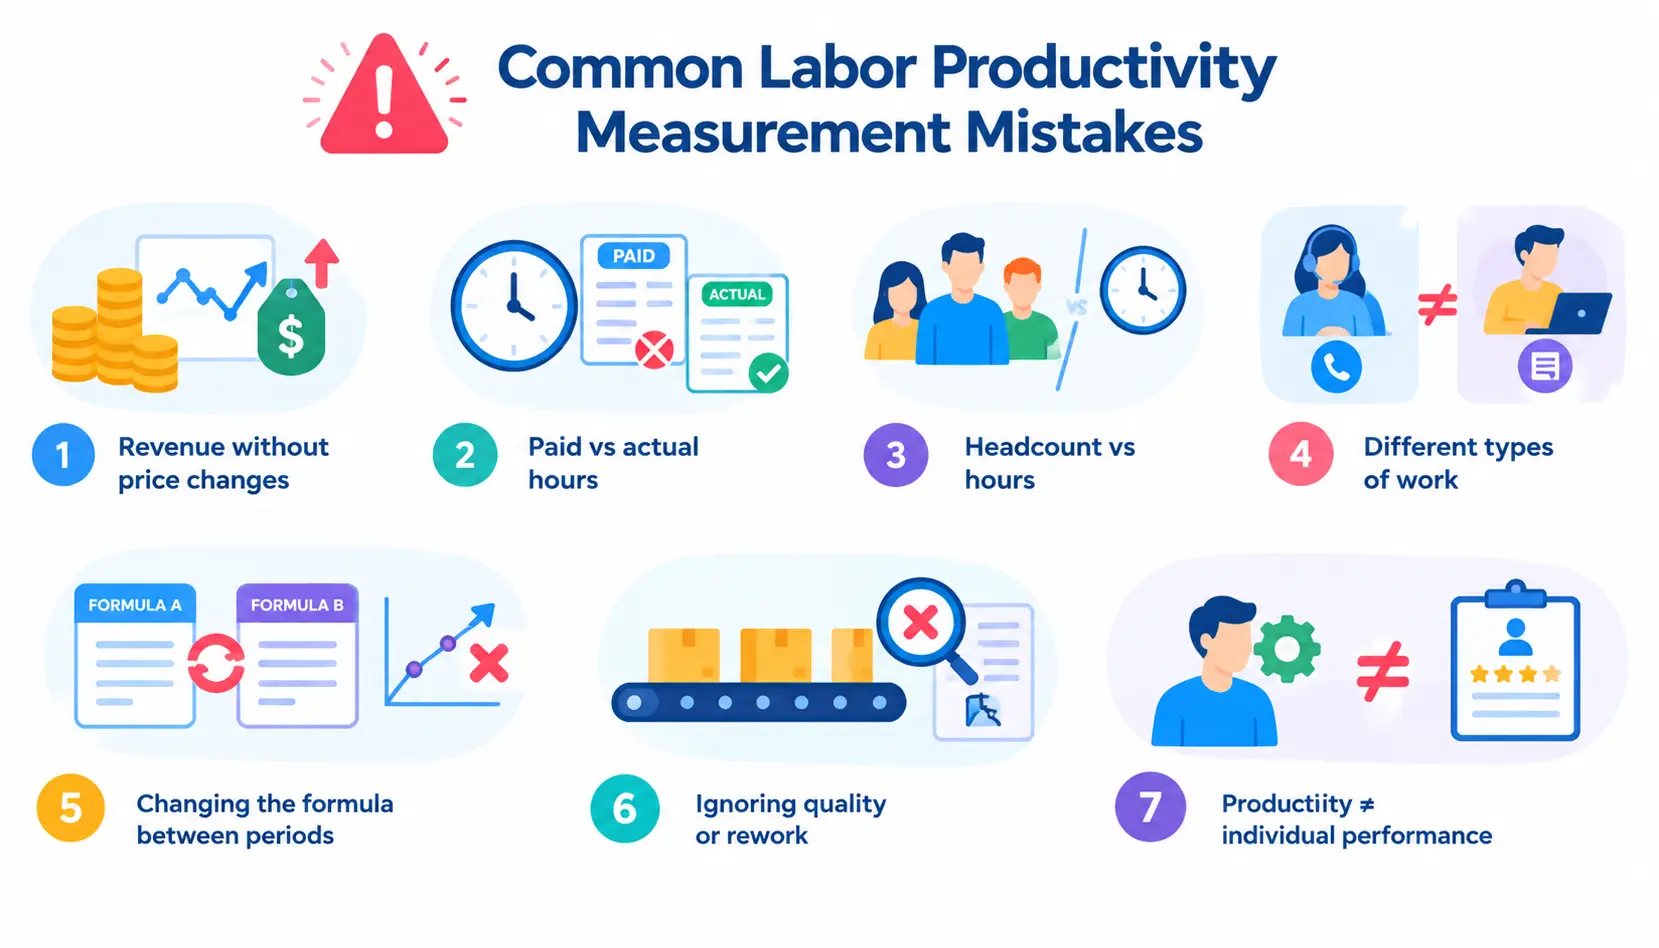
- Using revenue without considering price changes. Price shifts can mimic productivity changes.
- Mixing paid hours with actual hours worked. Pick one, and preferably use hours worked.
- Using headcount when hours would be better. This hides part-time and overtime differences.
- Comparing different types of work. Answering phones and writing reports are not comparable.
- Changing the formula between periods. You can no longer trust the trend.
- Ignoring quality or rework. Fast but faulty output is not productive.
- Treating productivity as employee performance. Productivity reflects the whole system, including tools, process, and management. Do not use it as a simple scorecard for individuals.
How to Improve Labor Productivity
Improve workflows. Map how work moves from start to finish and remove unnecessary steps.
Reduce bottlenecks. Find the slowest step. Improving anything else will not speed up the whole process.
Invest in technology. Automate repetitive tasks, but check the payoff.
Improve training. Invest in onboarding and ongoing skills.
Reduce rework. Fixing defects consumes hours that produce no new output.
Improve equipment and capacity. Maintain machines, and make sure the workspace supports the work.
Monitor trends, not isolated results. One bad week is noise. Three bad months is a signal.
Labor Productivity Calculator
Input
- Output: 9,000 units
- Labor hours: 600
Calculation
Output ÷ labor hours = 9,000 ÷ 600
Result
15 units per labor hour
Optional calculations using the same data
- Output per worker (30 workers): 9,000 ÷ 30 = 300 units per worker
- Output per labor cost ($18,000): 9,000 ÷ 18,000 = 0.5 units per dollar
To calculate this in Excel, put output in cell B2 and hours in C2, then enter =B2/C2 in D2. For growth, if last period’s result is in D2 and this period’s is in D3, use =(D3-D2)/D2 and format the cell as a percentage.
Labor Productivity Formula Cheat Sheet
| Metric | Formula |
| Labor productivity | Output ÷ labor input |
| Output per hour | Output ÷ labor hours |
| Output per worker | Output ÷ workers |
| Output per labor cost | Output ÷ labor cost |
| Productivity growth | Change in productivity ÷ previous productivity × 100 |
| Unit labor cost | Labor compensation ÷ real output |
Frequently Asked Questions About Labor Productivity
1. How do you calculate labor productivity?
Divide your total output by your total labor input. For example, 1,200 units produced in 100 labor hours gives 12 units per hour.
2. What is the basic labor productivity formula?
Labor Productivity = Output ÷ Labor Input. Labor input is usually hours worked, but it can be workers or labor cost.
3. Is labor productivity output per hour or per employee?
Both are used. Output per hour is more precise and matches the standard used by BLS. Output per employee is simpler but can hide differences in hours worked.
4. What should be used as output?
Use whatever best reflects the real work: units, tickets, completed jobs, or inflation-adjusted value. Keep the definition consistent over time.
5. Should I use revenue or units produced?
Use units when your products are similar and easy to count. Use revenue only if you adjust for price changes or accept that price will affect the result.
6. How do you calculate productivity growth?
Subtract the previous period’s productivity from the current period’s, divide by the previous period’s, and multiply by 100.
7. How do you calculate labor productivity in Excel?
Enter output and hours in two cells and divide them, for example =B2/C2. For growth, use =(D3-D2)/D2 and format as a percentage.
8. What is a good labor productivity ratio?
There is no universal number. A good ratio is one that is higher than your own past results and reasonable against comparable teams doing the same type of work.
9. What factors affect labor productivity?
Technology, equipment, skills, training, production processes, management, and supplier reliability all play a role.
10. What is the difference between labor productivity and multifactor productivity?
Labor productivity compares output to labor only. Multifactor productivity compares output to several inputs together, such as labor, capital, energy, and materials.
Conclusion
Learning how to calculate labor productivity is straightforward: divide output by labor input. The real skill lies in choosing the right output, counting hours accurately, and comparing results over time.
Start with output per labor hour, keep your definitions consistent, and track the trend. Once you have a reliable baseline, you can spot bottlenecks and test improvements with confidence.

Mehreen Mushtaq is a skilled content writer dedicated to creating high-quality, engaging, and SEO-focused blogs. She specializes in strategic keyword usage, search intent, and informative content that connects with readers while helping websites strengthen their visibility and rankings in search results.