
A new hire finishes onboarding on Friday. On Monday, they sit down to do the real work, and everything feels slower than expected. That is normal.
Knowing how to do a task and doing it well on the job are two different things. The gap between them closes with practice, feedback, and time.
Understanding the learning curve in employee training gives you a way to see that gap, measure it, and shrink it. A learning curve shows how performance changes as a person gains experience with a task. With it, you can set realistic ramp-up goals, spot people who are stuck, and check whether your training actually works.
This guide covers the stages employees move through, the factors that speed up or slow down progress, and a step-by-step way to measure it. You will also find practical examples, a 30-60-90-day plan, and answers to common questions.
What Is a Learning Curve in Employee Training?
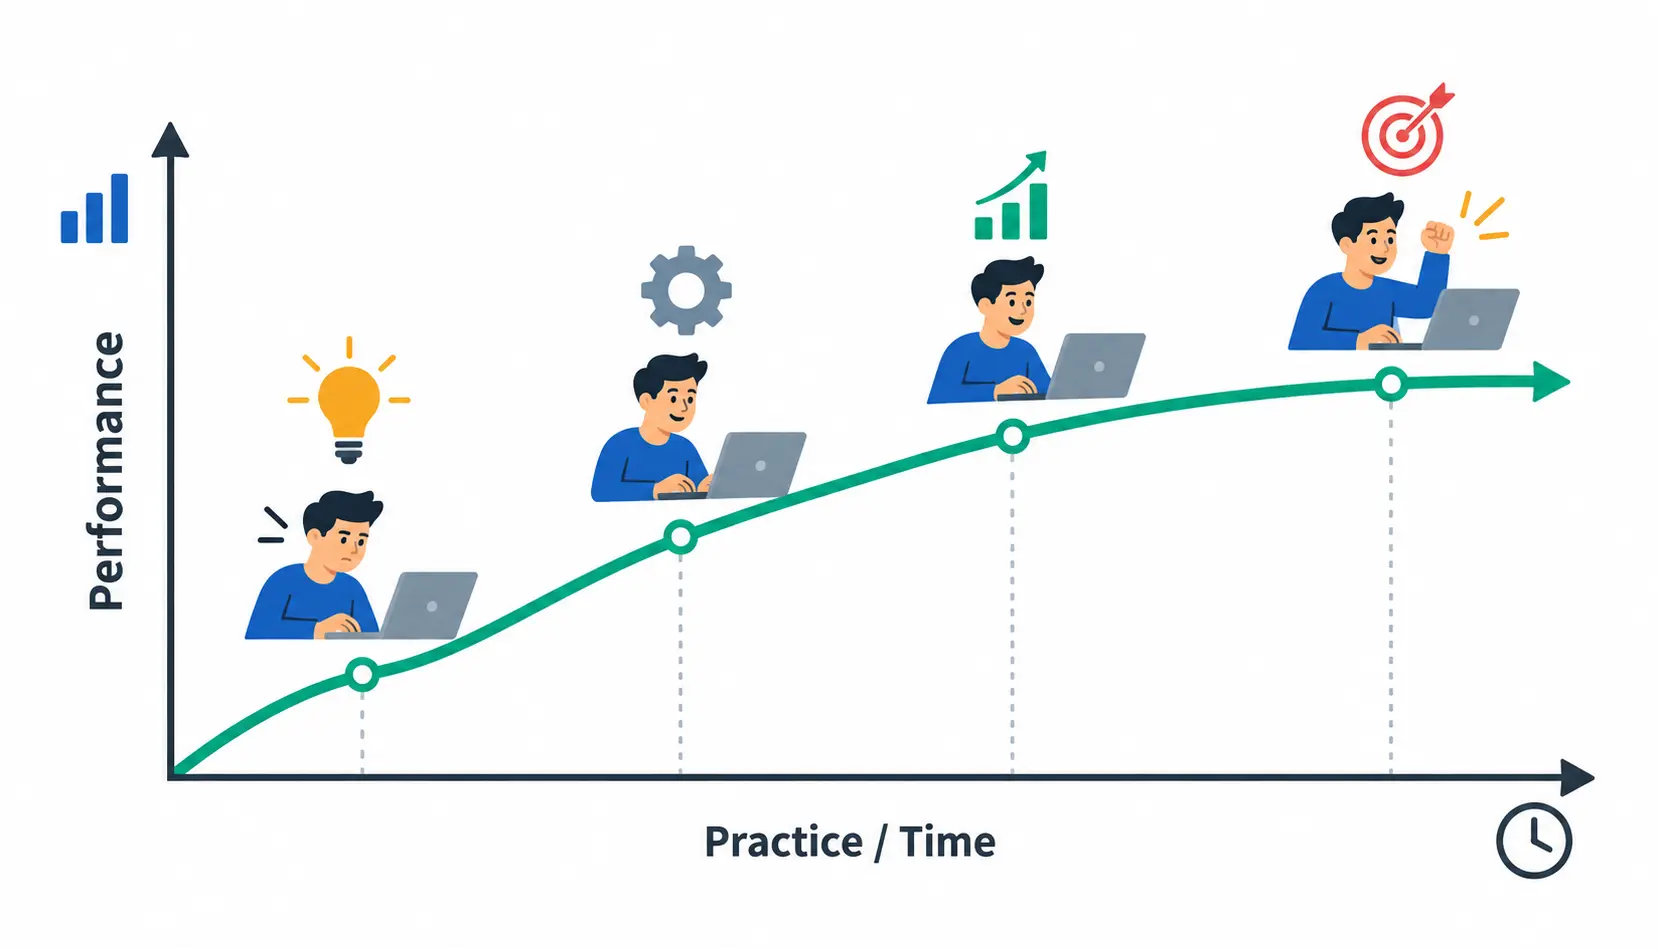
A learning curve in employee training is a graph that shows how an employee’s performance on a task changes with practice and experience. Time or repetitions go on the horizontal axis. A performance measure, such as accuracy, speed, or output, goes on the vertical axis. The shape of the line shows how quickly the person is learning.
The idea is simple. The more someone practices a task, the better they usually get at it. But the improvement is rarely a straight line. Early gains tend to come fast, and later gains tend to come slowly.
The concept has a long history. Psychologists studied how people learn and forget as far back as the 1880s, and engineer T. P. Wright later used the idea to describe falling labor costs in aircraft production. If you want the academic background, the article on the learning curve is a good starting point.
One common source of confusion is the phrase steep learning curve. In everyday speech, it means a skill is hard to learn. On a graph, a steep upward line means someone is improving quickly. Always check how the axes are defined before you interpret the shape.
How Does a Learning Curve Work?
A learning curve works by plotting one performance measure against repeated attempts or time. The horizontal axis shows practice, such as sessions, days, or tasks completed. The vertical axis shows the outcome you care about, such as accuracy rate or minutes per task.
Here is a quick example. A new support agent takes 14 minutes to resolve a ticket on day one. By session eight, the average is six minutes. If you plot task time on the vertical axis, the line slopes downward, and a falling line means improvement.
That is why you should define one metric at a time. If you mix speed, accuracy, and customer satisfaction on one line, the graph becomes hard to read. Plot each measure separately, then look at them together.
Why Is the Learning Curve Important in Employee Development?
The learning curve matters because it turns a vague idea, ‘they are still learning’, into something you can see and manage. It helps you plan onboarding, support new hires at the right moments, and judge whether training is working.
Here is what it helps you do:
- Build skills and confidence. People who see their own progress tend to feel more capable and more willing to ask questions.
- Shorten time to proficiency. You can find the point where an employee can work to standard without constant help.
- Reduce errors and boost productivity. Tracking mistakes over time shows where training needs to improve.
- Use training budgets wisely. Data shows which programs speed up learning and which ones do not.
- Improve continuously. Each new cohort gives you evidence to refine the next round of training.
What Are the Main Stages of the Learning Curve in Employee Training?
Most employees move through four broad stages: initial learning, accelerating practice, a slower plateau, and proficiency. Treat this as a practical framework, not a rule. Real people skip stages, repeat them, or move at different speeds depending on the task.
Stage 1: Initial Learning and Adjustment
In the first stage, everything is new. The employee is learning the tools, the vocabulary, the process, and the unwritten rules at the same time. Progress can look slow, and early mistakes are common.
Managers can reduce confusion here with a few simple moves:
- Explain why the task matters, not just how to do it.
- Share a short checklist for the first week.
- Name one person the employee can ask without feeling judged.
- Limit the number of new things introduced each day.
Stage 2: Practice and Accelerating Improvement
This is where repetition starts to pay off. The employee has the basics, and each practice round makes the steps feel more natural. Improvement often speeds up, and the curve rises sharply.
Guided practice and quick feedback matter most in this stage. Watch for signs of growing independence: fewer questions about basic steps, fewer corrections, and more confident decisions. When you see those signs, step back a little and let the employee own more of the work.
Stage 3: Slower Progress and the Learning Plateau
At some point, gains get smaller. The easy improvements are done, and the remaining ones take more effort. Many employees feel stuck here, and some managers worry something is wrong.
A slow-down is not always a real plateau. Check the data over several sessions before you act. A genuine plateau shows flat performance across multiple measurements, even though the employee is still practicing. A short dip after a new tool or a busy week is usually just noise.
Stage 4: Proficiency and Continued Development
Proficiency means the employee meets a defined standard consistently, without extra support. The standard should be specific to the role. For example, ‘resolves standard tickets within eight minutes at 95% accuracy’ is clear. ‘Performs well’ is not.
Learning does not stop here. Proficient employees can move on to harder tasks, adapt to process changes, and help train others. That is how a team keeps improving.
What Are the Different Types of Learning Curves?
Different tasks produce different learning patterns. A simple data-entry task looks nothing like learning to negotiate contracts. Knowing the common shapes helps you set better expectations and spot problems earlier.
Diminishing-Returns Learning Curve
This curve shows fast early improvement, then slower gains. It is the most familiar shape, and it fits simple, repeatable tasks. A new warehouse employee, for instance, may improve a lot in the first week of scanning items and then improve only slightly after that.
Increasing-Returns Learning Curve
Here, progress starts slowly and then speeds up. It tends to appear when a skill depends on understanding several linked ideas. Think of an analyst learning a complex reporting system. The first weeks feel confusing, and then the pieces suddenly connect.
S-Shaped Learning Curve
The S-shaped curve combines the two patterns. There is a slow start, a fast middle, and a flattening at the end. Many real jobs follow this shape because they involve early adjustment, rapid growth, and a ceiling as skills mature.
Complex or Nonlinear Learning Patterns
Some learning does not fit a neat curve. Employees can slip backward when the task gets harder, when a new tool arrives, or when they take on several skills at once. A salesperson learning a new product and a new CRM at the same time will probably show an uneven line.
The table below compares the main patterns.
| Curve pattern | Typical characteristics | Employee training example |
| Diminishing returns | Fast early gains, then smaller improvements | Learning to scan and pack orders |
| Increasing returns | Slow start, then faster progress | Mastering a complex reporting system |
| S-shaped | Slow start, rapid middle, flattening finish | Onboarding a new customer support agent |
| Complex or nonlinear | Setbacks, jumps, and shifting difficulty | Learning a new product and a new CRM together |
Remember that these are descriptive models, not guaranteed paths. Use them to interpret your data, not to predict what any one employee will do.
What Factors Affect the Employee Learning Curve?
Six main factors shape how quickly an employee learns: prior knowledge, training quality, task complexity, motivation and practice time, manager support, and the work environment. You can influence most of them.
Prior Knowledge and Work Experience
Employees do not start from zero. Someone who used a similar tool at a past job will usually move faster than someone who did not. Skills like writing, problem solving, and communication also carry over.
This is why a single training plan for everyone often wastes time. Quick checks at the start can show who needs the full path and who can skip ahead.
Training Quality and Instructional Design
Good training has clear goals, a logical order, and content in manageable chunks. Poor training dumps everything at once and hopes it sticks. Even strong employees struggle when the material is disorganized.
Ask yourself a simple question: can the employee tell what they should be able to do by the end of each session? If not, tighten the objectives.
Task Complexity and Cognitive Load
Cognitive load is the amount of mental effort a task demands at once. Our working memory is limited, so a task with many steps and many decisions can overload a beginner. The cognitive load explains the theory in more depth.
In practice, you can lower the load by splitting complex tasks into parts. Teach one part, practice it, and then connect it to the next.
Motivation, Confidence, and Opportunity to Practice
People learn faster when they believe they can improve and have time to try. Both are needed. Motivation without practice time goes nowhere, and practice time without safety makes people hide their mistakes.
Psychological safety plays a big role here. It describes a team climate where people feel safe to ask questions and admit errors. Researcher Amy Edmondson helped bring the idea into workplace research, and you can read a summary on psychological safety page.
Managerial Support and Feedback
Managers shape the curve more than most people expect. Specific, timely feedback helps employees fix small errors before they become habits. Vague comments like ‘be more careful’ do not.
A useful rule is to link feedback to something you both can see. For example, say ‘three of your last ten tickets missed the refund step’ instead of ‘your accuracy is low’.
Tools, Technology, and Workplace Environment
The work setting matters. Clunky software, missing documentation, and constant interruptions all slow learning. An employee cannot practice well if they are pulled into urgent tasks every ten minutes.
Check whether new hires have the right access, a working setup, and protected practice time. These basics are easy to overlook, and they cost a lot when missing. Providing employees with effective cloud-based productivity and collaboration tools can simplify information sharing, improve coordination, and reduce workflow friction during training.
How Does the Learning Curve Affect Employee Performance and Productivity?
The learning curve affects performance because productivity rises as employees gain skill. Early on, tasks take longer, errors are more likely, and coworkers spend time helping. As employees improve, they work faster, make fewer mistakes, and need less support.
Time to Proficiency and Employee Independence
Time to proficiency is how long it takes an employee to meet the standard for their role. Independence is a good sign of it. When an employee can handle routine tasks without constant supervision, they have reached an important milestone.
Track when each person reaches that point. Over a few hiring cycles, you will see realistic ramp-up times for each role.
Accuracy, Errors, and Rework
Speed alone does not prove competence. An employee who finishes tasks quickly but makes frequent mistakes creates rework for others. That hidden cost often shows up later as customer complaints or repeated fixes.
Measure speed and accuracy together. A healthy learning curve usually shows both improving over time, even if one moves faster than the other.
Employee Confidence and Engagement
Progress that people can see keeps them engaged. When an employee can look at a chart and say ‘my error rate has dropped by half’, confidence grows. When progress is invisible, people often assume they are failing.
Share progress openly, and celebrate small wins. It costs little and helps employees stay motivated through the harder middle stages.
Business Efficiency and Training Costs
A long learning curve costs money. New hires produce less, experienced staff spend time supporting them, and errors create extra work. A shorter, well-managed curve lowers all three costs.
That does not mean rushing people. It means removing avoidable obstacles so employees reach the standard sooner without cutting corners. Alongside effective training, the right tools that help increase employee productivity can streamline workflows, reduce repetitive tasks, and help employees focus on higher-value work.
How Can Organizations Shorten the Employee Learning Curve?
Organizations can shorten the employee learning curve by aligning training with real job requirements, providing structured practice, giving timely feedback, and measuring progress against clear standards. Each of the nine tactics below supports those four ideas.
Assess Existing Skills Before Training
Start with a baseline. A short skills check or a practice task shows what each person already knows. You can then skip what they have mastered and focus on real gaps.
Break Training Into Manageable Learning Units
Small units are easier to absorb than long sessions. Microlearning, which delivers short focused lessons, can work well for specific skills and refreshers. The Wikipedia entry on microlearning covers the basics. Use it where it fits, not for every topic.
Combine Demonstrations With Hands-On Practice
Watching someone do a task is useful, but doing it yourself is what builds skill. Pair each demonstration with practice. Simulations, guided exercises, and supervised real tasks all work well.
Provide Regular Feedback and Coaching
Short, frequent check-ins beat a single review at the end of the month. Tie your comments to observable behavior, and agree on one or two things to improve next. Too many suggestions at once overwhelm people.
Use Spaced Practice and Knowledge Reinforcement
People forget new material quickly unless they revisit it. Spacing practice over days and weeks helps skills stick. You can learn more about the technique on the Wikipedia page for spaced repetition.
Simple ways to do this include short quizzes, scenario reviews, and repeating key tasks a week or two after the first training.
Personalize Training to Role and Experience
A senior hire and a recent graduate do not need the same path. Adjust the depth, pace, and support based on what each person shows they can do. Personalization does not need fancy tools. A simple skills checklist is often enough.
Introduce Mentoring and Peer Learning
A mentor gives new hires someone safe to ask. Peers can also share shortcuts and real-world tips that formal training misses. Give mentors clear expectations and protected time, or the program will fade.
If you want to see how other practitioners approach this, communities such as instructional design on Reddit and LinkedIn Learning’s resources for learning leaders are worth browsing for ideas and discussion.
Use Digital Adoption Tools for Software Training
For software-heavy roles, in-app guidance can help. Walkthroughs, tooltips, and contextual help show employees what to do inside the tool, right when they need it. They support training, but they do not replace practice and coaching.
Create a Supportive Learning Environment
People learn faster when mistakes are treated as part of the process. Encourage questions. Make it clear that early errors are expected, and explain how to recover from them. A calm environment lets employees focus on learning instead of protecting themselves.
How Do You Measure an Employee Learning Curve?
To measure an employee learning curve, define the skill and the standard, record a baseline, track the same measure over repeated practice sessions, plot the results, compare them with benchmarks, and adjust training. Six steps cover the whole process.
Step 1: Define the Skill and Proficiency Standard
Pick one observable task, such as resolving a standard support ticket or completing a purchase order. Then describe what good looks like in numbers. For example: ‘Resolves a standard ticket in under seven minutes with at least 95% accuracy, without help.’
If you cannot describe the standard, you cannot tell when someone reaches it. Get this step right before you collect any data.
Step 2: Record Baseline Performance
Capture the starting point. This might be task duration, accuracy, quality score, or output per hour. Use the same method every time so the numbers stay comparable.
The baseline also protects you from guessing. It shows how far each person has actually moved.
Step 3: Track Performance Across Practice Sessions
Record the same measure after each session, day, or batch of tasks. Consistency matters more than volume. Five clean data points beat twenty messy ones.
Keep the conditions similar where you can. Comparing a quiet Tuesday with a month-end rush will distort the picture.
Step 4: Plot and Interpret the Learning Curve
Put practice sessions on the horizontal axis and your chosen measure on the vertical axis. A simple spreadsheet chart is enough. Then read the shape:
- Steady upward movement (or downward, for time) means the employee is improving.
- Smaller gains suggest the easy wins are done and the curve is flattening.
- A long flat line may signal a plateau worth investigating.
- A sudden dip often points to a change in task, tool, or workload.
Step 5: Compare Results With Proficiency Benchmarks
Check the results against the standard you set in Step 1. Look at both speed and quality. Also ask whether the employee can do the work independently, since needing help is a hidden cost.
Use benchmarks from your own team where possible. An employee in a complex role should not be judged against a simple one.
Step 6: Adjust Training and Reassess
Use what you learned to give targeted support. If accuracy lags, add practice on the tricky steps. If speed lags, look for friction in the tools or process.
Then reassess after a few weeks. This also lets you confirm that the skill has stuck and has not faded.
Which Metrics Should HR and L&D Teams Track?
Track a small set of metrics tied to the role. Too many numbers make the data hard to use. The table below lists the most useful ones. HR teams can also use an employee productivity calculator to assess workforce output and compare productivity against defined targets.
| Metric | What it shows | How to collect it |
| Time to proficiency | How long it takes to reach the standard | Date of start versus date standard is met |
| Task completion time | Speed on a defined task | System timestamps or timed observation |
| Error rate | Accuracy and rework needs | Quality checks, defect logs |
| Quality score | How well the work meets expectations | Manager or peer review using a rubric |
| Independent task completion | Whether help is still needed | Supervisor notes, help-request logs |
| Knowledge retention | Whether skills last over time | Follow-up assessment weeks later |
| Business outcomes | Link to results such as customer satisfaction | Existing team dashboards |
Example of an Employee Learning-Curve Tracking Table
Here is an illustrative table for a new support agent processing tickets. The numbers are examples to show the method, not benchmarks.
| Practice session | Average completion time | Accuracy | Support required |
| 1 | 14 min | 78% | Help on most tickets |
| 2 | 11.5 min | 83% | Frequent help |
| 3 | 9.5 min | 87% | Frequent help |
| 4 | 8 min | 90% | Occasional help |
| 5 | 7 min | 92% | Occasional help |
| 6 | 6.5 min | 93% | Rare help |
| 7 | 6.2 min | 93% | Rare help |
| 8 | 6 min | 94% | Independent on standard tickets |
Notice how the gains shrink after session five. That is a typical diminishing-returns shape. If the agent’s accuracy stalls at 93% while the target is 95%, you know exactly where to focus coaching.
How Can You Calculate Training ROI?
To estimate training ROI, add up the benefits from fewer errors, less rework, and faster ramp-up. Subtract the total cost of training and implementation. Then divide by that cost. The general method is described on Wikipedia’sreturn on investment page.
The formula is: ROI (%) = (Total benefits − Total costs) ÷ Total costs × 100.
State your assumptions openly. Here is a simple illustration, with all numbers invented for the example:
- 20 new hires per year reach proficiency 10 working days sooner. Each day saved is worth $100 in recovered productivity. Benefit: 20 × 10 × $100 = $20,000.
- Rework drops by 300 cases per year. Each case takes 0.5 hours at $30 per hour. Benefit: 300 × 0.5 × $30 = $4,500.
- Total benefit: $24,500.
- Costs: $9,000 to design the program plus $3,000 in manager and mentor time, so $12,000 in total.
- ROI: ($24,500 − $12,000) ÷ $12,000 × 100, or about 104%.
Use your own figures, and avoid counting benefits you cannot trace to the training. A conservative estimate builds more trust than an optimistic one.
What Should Managers Do When an Employee Reaches a Learning Plateau?
When an employee plateaus, first confirm the plateau is real, then find the cause, and then adjust the support. Do not simply repeat the same training. Four steps help.
Identify the Source of the Plateau
Look at the common causes first. Is a prerequisite skill missing? Is the workload leaving no time to practice? Are the instructions unclear, the task too complex, or the feedback too rare?
Often the cause is simple and fixable. A conversation with the employee usually reveals it fast.
Review Performance Data and Employee Feedback
Break the task into subskills and look at each one. An employee may be strong on data entry but weak on judgment calls. Pair the numbers with the employee’s own view of what feels hard.
Adjust Practice, Coaching, or Training Materials
Target the weak spot. Add focused practice, a short coaching session, or a clearer job aid. Retaking the entire course wastes time and can frustrate people.
Set a New Milestone and Monitor Progress
Agree on the next achievable target and a date to review it. Small, specific goals work better than big vague ones. For example, ‘raise accuracy from 93% to 95% in three weeks’ is clear and testable.
Understanding the Learning Curve in Employee Training: Real-World Examples
Examples make the ideas easier to apply. The three below are illustrative scenarios, and your own roles will have different measures and standards.
Example 1: A New Customer Support Representative
A support agent handles tickets, writes replies, and decides when to escalate. In the first weeks, response time is long and accuracy is uneven. Escalation judgment is often the slowest skill to develop.
A manager tracks three measures: handling time, response accuracy, and correct escalations. Handling time improves quickly, while escalation judgment improves slowly and needs coaching on real cases.
Example 2: Employee Training for New Business Software
A team moves to a new finance system. The measures here include how many workflows employees complete correctly, how many errors they make, and how often they ask for help.
A common pattern is a short dip right after launch, followed by steady improvement. In-app guidance and quick reference guides can reduce the dip, but practice with real tasks still drives the result.
Example 3: Manufacturing or Operational Training
On a production line, cycle time, defect rate, and quality checks are standard measures. Safe task execution matters as much as speed. An operator who is fast but skips safety steps has not met the standard.
Here, the learning curve is often tied to supervised practice and clear sign-off criteria before the person works alone.
What These Examples Teach Managers
Each role needs its own definition of proficiency. A good score in one job means little in another. Choose measures that fit the task, set the standard in advance, and review the data on a regular schedule.
Learning Curve vs. Forgetting Curve vs. Experience Curve
These three terms sound alike, but they measure different things. The learning curve tracks improvement through practice. The forgetting curve tracks how memory fades without reinforcement. The experience curve tracks falling costs across an organization or industry as total output grows.
- Learning curve: performance change for an individual or group as they practice a task.
- Forgetting curve: the decline in retained knowledge over time. German psychologist Hermann Ebbinghaus described it in the 1880s. See the Wikipedia page on the forgetting curve.
- Experience curve: the drop in unit costs as cumulative production rises, popularized in business strategy in the 1960s. See the Wikipedia page on the experience curve effect.
| Concept | What it measures | Workplace application |
| Learning curve | Skill improvement with practice | Onboarding plans, time to proficiency |
| Forgetting curve | Loss of knowledge over time | Refresher training, spaced reinforcement |
| Experience curve | Cost reduction as total output grows | Strategy, pricing, production planning |
In practice, you can assess learning progress and retention together. Measure performance at the end of training, and measure it again two to four weeks later. If the second score drops, add reinforcement before the skill fades further.
Common Mistakes to Avoid When Managing Employee Learning Curves
Most problems come from a handful of habits. Watch for these:
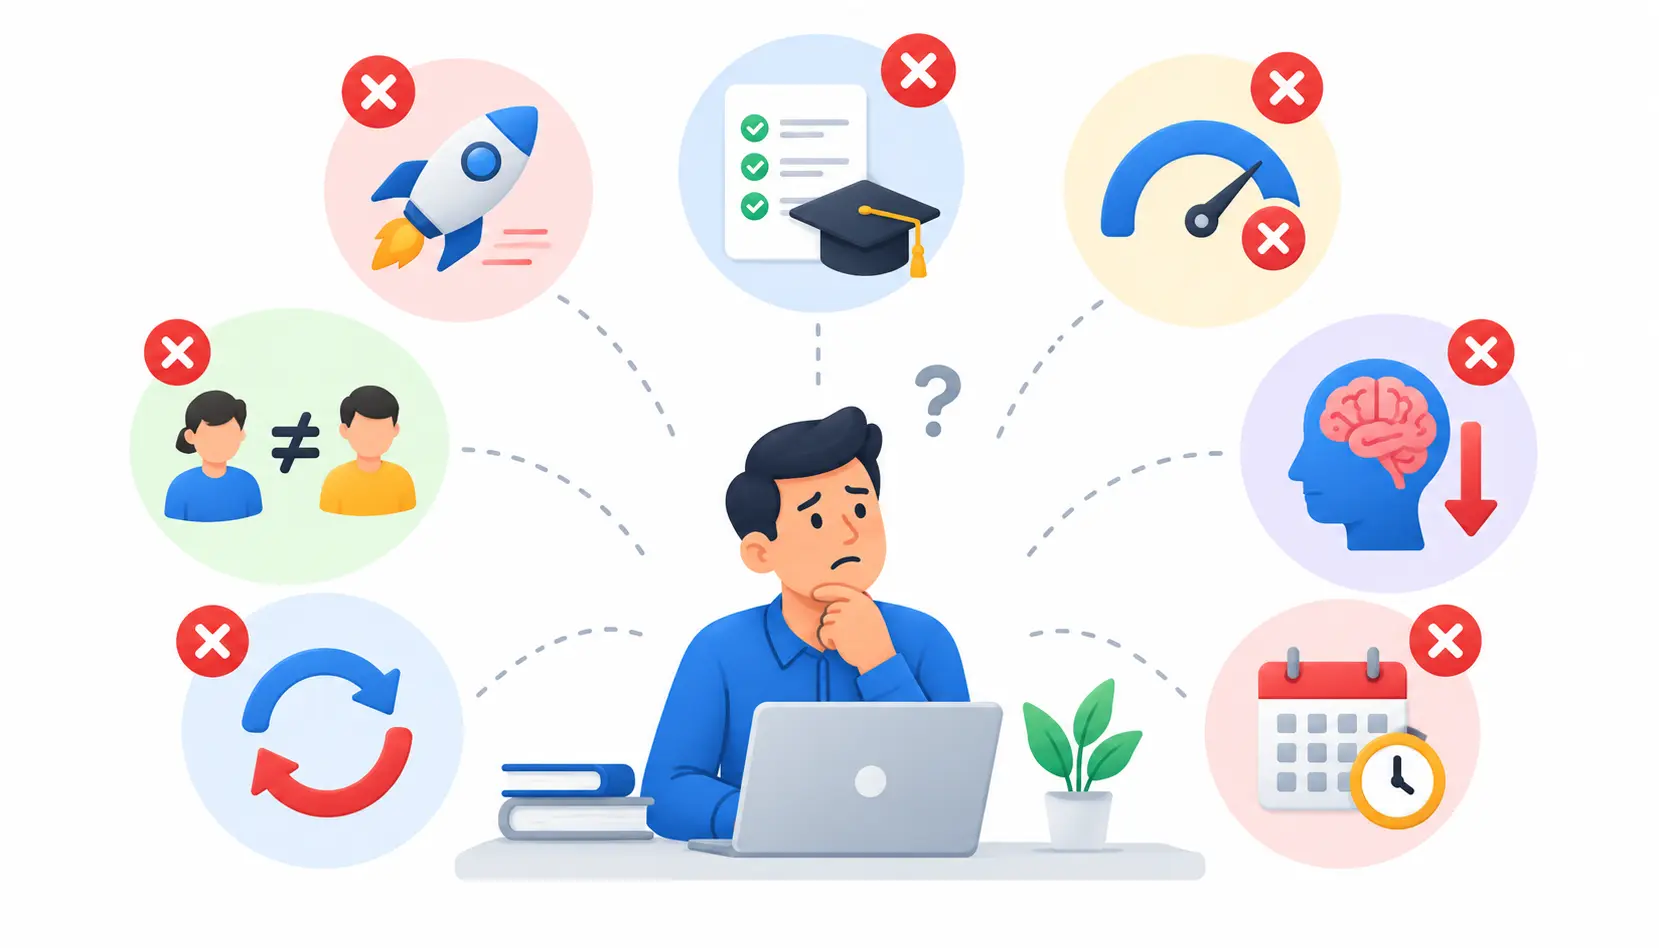
- Expecting instant productivity. Training ends, but learning continues on the job.
- Measuring course completion instead of performance. Finishing a module does not prove someone can do the work.
- Treating speed as the only measure. Fast and wrong creates rework.
- Comparing people without context. Different roles, tasks, and starting points produce different curves.
- Ignoring retention. Without follow-up, skills fade.
- Repeating ineffective training. Diagnose the problem first.
- Using arbitrary deadlines. Base timelines on defined proficiency standards, not on a calendar date.
How to Build a Learning-Curve Improvement Plan for the First 30, 60, and 90 Days
A 30-60-90-day plan gives structure to the early months. Treat it as an adaptable example. Some roles need weeks, others need much longer, so adjust the timing to the task.
First 30 Days: Foundations and Baseline
Introduce the core tasks, set up the tools, and record baseline performance. Use this time to find skill gaps early. Keep the goals small and clear.
Days 31 to 60: Guided Practice and Feedback
Give the employee more ownership of real tasks. Review progress every week and coach on specific weak spots. Aim for fewer corrections and growing independence.
Days 61 to 90: Proficiency and Continued Development
Evaluate performance against the role standard. Confirm that skills have stuck, and decide what to learn next. Plan the following stage of growth before the 90 days end.
| Period | Milestone | Responsible | Evidence | Reassessment criteria |
| Days 1 to 30 | Core tasks introduced, baseline recorded | Manager, mentor | Baseline data, skills checklist | Gaps identified and practice plan agreed |
| Days 31 to 60 | Handles routine tasks with coaching | Manager, mentor, employee | Weekly progress charts, review notes | Accuracy and speed trending toward the standard |
| Days 61 to 90 | Meets role standard on routine tasks | Manager, employee | Performance versus benchmark, retention check | Standard met consistently; next skills chosen |
Frequently Asked Questions
1. How long does it take an employee to learn a new job?
There is no universal answer. Simple roles may take a few weeks, while complex ones can take many months. The better approach is to define a proficiency standard for the role and track when employees reach it. Over several hires, you will see a realistic range.
2. What does a steep learning curve mean?
On a graph, a steep learning curve means fast improvement over a short time. In everyday speech, people often use it to mean a skill is hard to learn. Context matters, so check how the axes are defined before you interpret the phrase.
3. How do you measure an employee’s learning curve?
Define a proficiency standard, record baseline performance, and track one measure, such as task time or accuracy, over repeated sessions. Plot the results and compare them with your benchmark. Adjust the training where progress stalls, and recheck later to confirm retention.
4. What causes an employee learning plateau?
Common causes include a missing prerequisite skill, unclear instructions, too little practice time, heavy workload, and infrequent feedback. A plateau can also appear when the easy gains are finished and the remaining ones need targeted coaching. Review the data and talk with the employee to find the cause.
5. How can managers accelerate employee skill development?
Managers can assess starting skills, break training into small units, and pair demonstrations with hands-on practice. Give specific feedback often, space out reinforcement, and create a safe environment for questions. Mentoring and clear proficiency standards help employees stay on track.
6. What is the difference between a learning curve and a forgetting curve?
A learning curve shows how performance improves with practice. A forgetting curve shows how retained knowledge declines over time without review. One tracks gaining skill, and the other tracks losing it. Use both to design training and follow-up.
7. How do you measure training effectiveness beyond course completion?
Look at workplace performance. Track accuracy, task time, independence, quality scores, and later retention. Where possible, link results to business outcomes such as fewer errors or faster ramp-up. Completion rates show attendance, not skill.
8. How does software complexity affect employee learning?
Complex software has more features, steps, and decisions, which increases cognitive load and slows early progress. Clear workflows, staged training, and in-app guidance can help. Always pair them with hands-on practice on real tasks.
Conclusion
Understanding the learning curve in employee training helps you replace guesswork with evidence. You can see how people improve, where they get stuck, and which support actually helps. That makes onboarding faster, fairer, and easier to improve.
Start small. Pick one role, define the proficiency standard, and track one metric over a few weeks. Then use what you learn to coach, adjust, and reassess.
When you measure progress against clear standards, training stops being an event and becomes a path to real performance.

Mehreen Mushtaq is a skilled content writer dedicated to creating high-quality, engaging, and SEO-focused blogs. She specializes in strategic keyword usage, search intent, and informative content that connects with readers while helping websites strengthen their visibility and rankings in search results.