

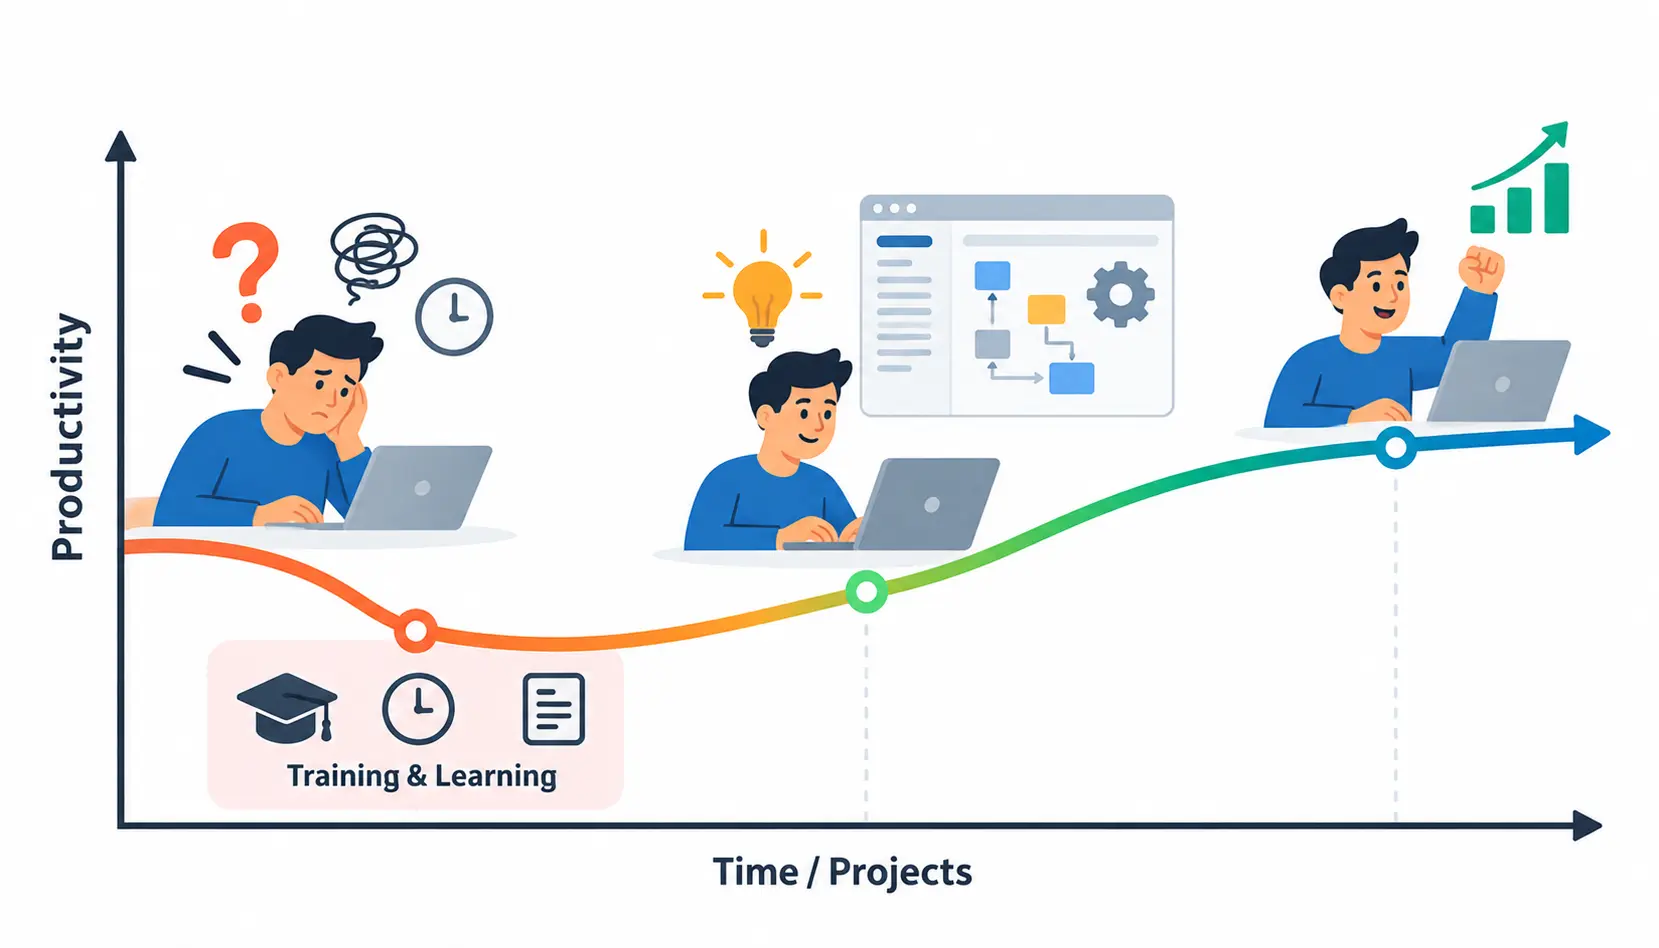
A new tool rarely makes a team faster on day one. Most teams get slower first, and that dip surprises managers who expected quick wins. Understanding how the learning curve affects CASE tool adoption helps you plan for that dip, measure it fairly, and decide with evidence instead of gut feeling.
The learning curve affects CASE tool adoption by adding early learning costs, such as training time, slower work, and rework. Productivity may drop at first and improve as teams complete more projects with the tool. Judging a tool from one early project is risky. Measure results across several comparable projects instead.
This guide explains what the learning curve is, what research says, and how to measure it. It also covers how to shorten it and when to rethink a tool. It is written from the view of someone who has watched teams roll out engineering tools, and who has seen good tools get dropped too early.
What Is a Learning Curve in CASE Tool Adoption?
A learning curve describes how performance changes as people gain experience with a task or tool. In CASE tool adoption, it describes how a team’s speed and quality change as they get used to a new tool. The first projects usually cost the most effort. Later projects usually go smoother.
What Are Computer-Aided Software Engineering (CASE) Tools?
Computer-aided software engineering (CASE) tools are software products that support parts of the software development process. They can help with requirements, design, code generation, testing, and documentation.
Think of them as power tools for builders. They can speed up the work, but only after you learn how to handle them.
What Is a Learning Curve in Software Engineering?
In software engineering, a learning curve shows how effort, time, or defects change as a team repeats similar work. People get faster and make fewer mistakes with practice. A steep curve means people learn quickly. A shallow curve means progress is slow. Neither is good or bad by itself. What matters is how much the learning costs you before the benefits show up.
How Integrated CASE Tools Differ From Individual Development Tools
An individual tool, such as a code editor plugin, solves one narrow problem. An integrated CASE tool covers several stages of the software development life cycle (SDLC) and links them through shared data. You can read more about those stages in Wikipedia’s SDLC article.
Integrated tools ask more from users. People must learn new concepts, new workflows, and how the stages connect. That is why their learning curves tend to be longer.
Why Learning Costs Matter During Technology Adoption
Learning is not free. Every hour spent in training or fixing early mistakes is an hour not spent on feature work. These costs are real, and they often get left out of the business case.
If you ignore them, a tool can look like a failure when it is really just early in its curve. If you plan for them, you can set honest expectations with your leadership.
How Does the Learning Curve Affect CASE Tool Adoption?
The learning curve affects CASE tool adoption in four main ways. It can lower early productivity, make results depend on training and experience, hide benefits in early projects, and push teams toward abandoning tools too soon.
Why Productivity Can Decline During Early Adoption
When a team switches tools, they spend time on things they used to do without thinking. They look up menus, ask colleagues, and redo steps. Even skilled engineers slow down.
The tool may also change how work gets done, not just how fast. People need time to adjust their habits. That adjustment shows up as slower delivery at first.
How Training and Experience Influence Performance
Training gives people a starting point. Experience turns that starting point into skill. Both matter, and one cannot replace the other.
A two-day workshop helps, but it will not make anyone an expert. Real fluency comes from using the tool on real projects, with real deadlines and real problems.
Why Initial Projects May Not Show Expected Benefits
The first project with a new tool carries the heaviest learning load. If you compare it with a past project done with familiar methods, the new tool will often look worse. That comparison is unfair, because you are comparing a beginner’s result with an expert’s.
The tool’s benefits tend to show up after the team has built some experience. Early data simply cannot tell you much about long-term results.
How Learning Costs Influence Adoption and Abandonment Decisions
When early results disappoint, managers feel pressure to cancel. Some of those cancellations are right, because the tool truly does not fit. Others happen because nobody separated learning costs from the tool’s real value.
That is the core risk. A team may drop a useful tool, or keep a poor one, because the evidence was read too early or too loosely.
What Does Research Say About Learning Curves and CASE Tools?
Research on this topic is older than many teams realize, but its main lessons still hold. The studies below are the ones most often cited, and I describe them in general terms so you can read the originals yourself.
Chris Kemerer’s Research on CASE Tool Adoption
Chris Kemerer, a professor who has written widely on software measurement, published a well-known article titled “How the Learning Curve Affects CASE Tool Adoption” in IEEE Software in 1992. It discusses how initial learning costs can hide a tool’s effects on productivity during early use. His central message is practical: do not judge a tool from its first project alone.
Learning Curve Models for Integrated CASE Tool Management
Kemerer’s work explains how learning curve models can help managers separate learning costs from the tool’s productivity effects. In plain terms, a model lets you ask two questions. How much of the slowdown comes from learning? And what is the tool doing once learning is accounted for?
This matters most for integrated tools, where learning takes longer and costs more.
Evidence From Studies of Back-End CASE Tools
Back-end CASE tools focus on later stages, such as code generation and testing. An empirical study of such tools found no statistically significant overall change in productivity for the tools it examined. That result does not prove these tools never help. It shows that gains are not automatic.
I would read this as a caution against marketing promises, not as a verdict on all CASE tools.
What the Research Can—and Cannot—Tell Us
The research supports a few careful points. Early productivity can be lower, models can help measure learning over time, and gains are not guaranteed. It cannot tell you how your team will perform, because organizations differ in skills, projects, and processes.
Also keep in mind that much of this work was done decades ago, with the tools of that era. The measurement ideas age well. Specific tool results do not.
| Research question | Evidence to discuss | Implication |
| Can early productivity be lower? | Historical research discusses initial learning costs | Do not judge effectiveness from a single early project |
| Can learning-curve models help? | Kemerer explains how models can separate learning costs from productivity effects | Measure adoption over time |
| Are productivity gains guaranteed? | An empirical study found no statistically significant overall change for the tools studied | Evaluate results in your organization’s own context |
This table summarizes findings from the original studies. It is not a universal conclusion, so please read the sources before citing them.
What Factors Influence the CASE Tool Learning Curve?
Not every team learns at the same pace. Several factors shape how steep or shallow the curve becomes.
Developer Experience and Technical Skills
Experienced engineers often grasp new concepts faster. But experience with old habits can also get in the way. A senior developer used to hand-written designs may resist model-driven workflows at first.
Tool Complexity and Integration Across the SDLC
The more stages a tool covers, the more there is to learn. Integrated tools bring more concepts, more settings, and more ways to make mistakes. Expect a longer curve.
Training Quality and Availability of Documentation
Good training is specific and hands-on. Poor training is a slide deck of features. Clear documentation also helps people solve problems on their own instead of waiting for an expert. Suitable cloud-based productivity and collaboration tools can help teams share documentation, coordinate work, and access learning resources more efficiently.
Project Complexity and Task Repetition
Learning speeds up when people repeat similar tasks. If every project is wildly different, practice does not carry over as well. Teams with repeatable work tend to learn faster.
Team Stability and Knowledge Transfer
When people leave, their learning leaves with them. Stable teams build knowledge steadily. Changing teams must keep restarting the curve unless they capture what they learn.
Management Support and Change Readiness
Teams learn faster when leaders give them time, patience, and a clear reason for the change. They learn slower when management expects full speed from week one.
Compatibility With Existing Workflows and Systems
A tool that fits current processes needs less change from users. One that clashes with version control, review habits, or reporting systems adds friction on top of learning.
How Do Learning-Curve Models Help Measure CASE Tool Adoption?
A learning-curve model is a simple way to track how performance improves with experience. You do not need advanced statistics to use the idea. You need consistent data and patience.
Understanding the Relationship Between Experience and Performance
The basic pattern is that performance improves as experience grows, quickly at first and then more slowly. The related idea of experience curve effects describes similar patterns in many industries. In software teams, the pattern is rarely smooth, but the direction is usually visible over time.
Measuring Cumulative Project Experience
Cumulative experience means the total amount of relevant work completed with the tool. It could be the number of projects, modules, or releases. This gives you a better x-axis than the calendar.
Distinguishing Time-Based and Project-Based Measurements
Time-based measures track results by month or quarter. Project-based measures track results by completed project. Each has a place, but they answer different questions.
Estimating Learning Costs and Future Productivity
Once you have a few data points, you can estimate how much extra effort learning has cost so far. You can also make a cautious guess about where performance may settle. Treat these estimates as rough, and update them as new projects finish.
Understanding the Limitations of Learning-Curve Models
Models assume the work is reasonably comparable from one project to the next. They also need enough data to be useful. With only two or three projects, any curve is a rough sketch.
Why Project-Based Measurement May Be More Useful
Elapsed time can mislead. A team may use a tool for six months but only finish one small project. Another team may finish four projects in the same period. Their months match, but their experience does not.
Measuring comparable completed projects shows how much real practice the team has had. It gives you fairer evidence than the calendar.
How to Measure the Learning Curve After Introducing a CASE Tool
Here is a practical process I recommend. It is simple enough for a small team and solid enough for a larger one.
Step 1: Establish a Pre-Adoption Baseline
Before the rollout, record how your team performs today. Capture cycle time, defects, and rework on recent projects. Without a baseline, you cannot tell whether the tool helped.
Step 2: Record Training and Implementation Costs
Track training hours, setup effort, licensing, and support time. Include the hours spent on configuration and migration. These costs belong in the final comparison.
Step 3: Choose Productivity and Quality Metrics
Pick metrics that match what the tool is meant to improve. A design tool should be judged on design quality and rework. A test tool should be judged on defects and test effort. Do not rely on raw lines of code or the number of completed tasks alone, since both can rise while quality falls. Writing
To evaluate adoption fairly, teams should measure employee productivity using consistent metrics, clear baselines, and quality-focused performance indicators.
Step 4: Track Performance Across Comparable Projects
Log the same metrics for each project. Compare projects of similar size and type. Keep the record in one shared place so the data stays consistent.
Step 5: Account for Project Complexity and Team Differences
Note when a project was unusually hard or when team members changed. These notes explain odd results later. A spike in rework may come from a messy requirement, not from the tool.
Step 6: Validate the Data and Interpret the Trend
Check that the numbers are complete and measured the same way each time. Then look at the trend across projects, not at any single point. One bad project is noise. Three in a row is a signal.
Metrics to Include in the Evaluation
| Metric | What it helps measure |
| Development cycle time | Time needed to complete comparable work |
| Training hours | Initial and ongoing learning investment |
| Rework rate | Effort spent correcting or repeating work |
| Defect rate | Software quality during adoption |
| Task completion rate | Ability to complete planned work |
| Support requests | Areas where users need additional assistance |
| Total implementation cost | Overall financial impact |
| Quality-adjusted productivity | Output considered alongside quality and rework |
Choose metrics based on the tool’s purpose. No single number tells the full story.
Practical Example: Evaluating the Learning Curve of a CASE Tool
This is a hypothetical example for illustration. The numbers are invented and do not describe any real tool or guarantee any result.
Imagine a team of eight engineers adopting a modeling and code-generation tool. They normally deliver medium-sized internal applications.
The Initial Implementation and Training Phase
The team spends two weeks on setup and training. Nobody ships features during part of that time. Management records these hours as adoption cost, not as lost productivity.
Measuring the First Few Projects
They track the next three comparable projects.
| Project | Duration vs. baseline | Training and support hours | Defects found | Rework share of effort |
| Baseline (old method) | 100% | 0 | 20 | 15% |
| Project 1 | 125% | 80 | 24 | 22% |
| Project 2 | 110% | 40 | 18 | 17% |
| Project 3 | 98% | 15 | 14 | 12% |
Project 1 looks bad. A manager who judged only that project might cancel the tool.
Comparing Later Projects With the Baseline
By Project 3, duration is near the baseline, while defects and rework are lower. The team is still learning, so more improvement may follow. It is too early to claim a final result, but the direction is encouraging.
Separating Learning Costs From Tool Benefits
The extra effort in Projects 1 and 2 is mostly learning cost. The team can estimate that cost and compare it with later savings. This turns a vague feeling into a business case.
What the Results Mean for Management
The sensible move is to continue, keep measuring, and review again after a few more projects. Management should also keep supporting the team with mentoring and templates.
How Can Organizations Reduce the CASE Tool Learning Curve?
You cannot remove the learning curve, but you can make it shorter and less painful.
Select Tools That Fit Existing Engineering Workflows
Choose tools that work with your version control, build, and review systems. The less you must change around the tool, the less there is to learn. Choosing the right tools that help increase employee productivity can streamline workflows, reduce repetitive work, and make it easier for teams to adapt to new systems.
Provide Role-Specific Training and Hands-On Practice
An architect, a developer, and a tester need different training. Give each role practice on realistic tasks. People remember what they do far better than what they hear.
Introduce the Tool Through a Controlled Pilot
Start with one small team and one low-risk project. A pilot limits damage, gives you early data, and reveals problems before a wider rollout.
Create Reusable Workflows, Templates, and Documentation
Capture what the pilot team learns. Templates, checklists, and short how-to notes help the next team skip the same mistakes.
Assign Experienced Users as Internal Mentors
A colleague who has used the tool can answer questions in minutes. That is often faster than reading documentation or contacting a vendor.
Collect Feedback and Resolve Adoption Barriers
Ask users what slows them down. Fix what you can, such as settings or missing templates. Small fixes often remove large amounts of friction.
Review Progress at Defined Milestones
Set review points ahead of time, such as after each completed project. Use the same metrics each time. This keeps decisions tied to evidence.
When Should an Organization Continue or Reconsider CASE Tool Adoption?
The goal is to separate a normal learning curve from a real problem. The signs differ.
Signs That the Team Is Progressing Through the Learning Curve
Rework falls, support requests become more specific, and users start to build their own shortcuts. Cycle times move toward the baseline across comparable projects.
Signs That Additional Training or Configuration Is Needed
Results vary a lot between team members. The same questions keep coming up. People avoid certain features. These point to training or setup gaps, not to a failed tool.
Signs of a Tool-Fit or Integration Problem
Problems persist even after training. The tool clashes with other systems, forces awkward workarounds, or cannot handle your type of projects. That suggests a fit issue.
How to Compare Long-Term Benefits With Total Adoption Costs
Add up training, setup, licenses, support, and early productivity loss. Compare that total with the measured gains in speed, quality, and maintenance effort. Use your own data, not vendor claims.
Building an Evidence-Based Continue, Adjust, or Stop Decision
Use this table as a starting point.
| Observed result | Recommended response |
| Productivity is improving and quality remains acceptable | Continue monitoring and refine workflows |
| Productivity is inconsistent and training gaps are evident | Provide targeted support and reassess |
| Rework or defects are rising | Investigate configuration, workflow, and quality issues |
| No meaningful benefit appears after a reasonable, evidence-based evaluation | Reassess the tool, implementation strategy, and business case |
No single time threshold fits every organization. A team with simple projects may know in a few months. A team with long projects may need much longer.
Common Mistakes When Evaluating CASE Tool Adoption

These mistakes show up again and again.
Expecting Immediate Productivity Gains
Vendors often suggest fast payback. Real teams usually need time. Plan for a dip.
Judging Success From a Single Project
One project is an anecdote. Several comparable projects form a pattern.
Ignoring Training and Implementation Costs
If you leave these out, the tool looks cheaper than it is. Include every hour and every license.
Comparing Projects With Different Levels of Complexity
A simple project finished with the tool does not beat a complex project finished without it. Compare like with like.
Measuring Speed Without Considering Quality
Fast delivery with more defects is not a win. Always read speed next to quality and rework.
Confusing User Resistance With Technical Failure
People may complain because change is uncomfortable, not because the tool is broken. Listen closely and check the data to tell the two apart.
Abandoning a Tool Before Collecting Reliable Evidence
Cancelling after one rough project wastes the learning already paid for. Set your review points first, then follow them.
Frequently Asked Questions About CASE Tool Adoption
1. What Is a Learning Curve in Software Engineering?
It is the pattern of improving speed and quality as a team gains experience with a tool or method. Early work is slower and more error-prone, and later work gets easier.
2. How Does the Learning Curve Affect CASE Tool Adoption?
It adds early costs and can lower productivity at first. It also makes single-project evaluations unreliable, so teams should measure results over several projects.
3. Why Can Productivity Decline After a CASE Tool Is Introduced?
People spend time learning features, adjusting habits, and fixing early mistakes. Setup and training also take hours away from regular development work.
4. How Can Organizations Measure CASE Tool Productivity?
Set a baseline, track comparable projects, and use metrics such as cycle time, defect rate, rework rate, and training hours. Read speed together with quality.
5. What Factors Influence the CASE Tool Learning Curve?
Developer experience, tool complexity, training quality, project type, team stability, management support, and fit with existing workflows all play a part.
6. How Can Training Improve Software Tool Adoption?
Role-specific, hands-on training helps people apply the tool to real tasks. Mentoring and good documentation keep that learning going after the course ends.
7. When Should an Organization Abandon a CASE Tool?
Only after a fair, evidence-based review shows no meaningful benefit, or when a clear fit problem remains after training and configuration. There is no universal time limit.
8. How Can Managers Evaluate the ROI of CASE Tool Adoption?
Compare total adoption costs, including learning costs, with measured gains in productivity, quality, and maintenance effort. Use your own project data and update it as more projects finish.
Conclusion
The learning curve affects CASE tool adoption more than most plans admit. Early slowdowns are normal, and they do not prove a tool is bad. They also do not guarantee it is good.
The best approach is to measure. Set a baseline, track comparable projects, include learning costs, and watch quality as well as speed. Then decide with evidence.
If you want to go deeper, read Kemerer’s original article and the related empirical studies directly. Check how their findings match your own context before you rely on them.

Mehreen Mushtaq is a skilled content writer dedicated to creating high-quality, engaging, and SEO-focused blogs. She specializes in strategic keyword usage, search intent, and informative content that connects with readers while helping websites strengthen their visibility and rankings in search results.